Report output differences
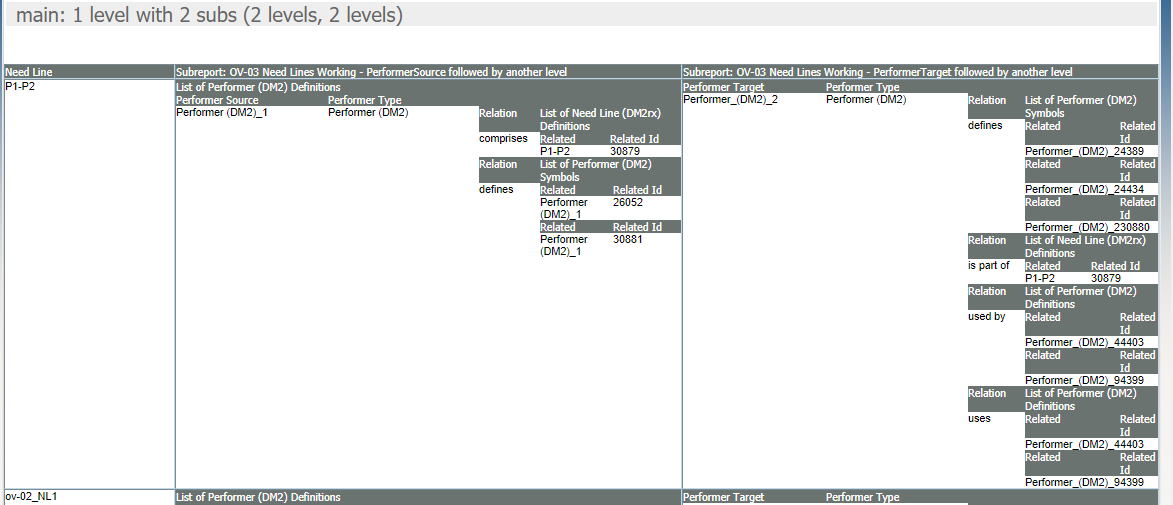
Taking a 1-level report on DoDAF2 Need Lines and their source and target performers through subreports which then identify related items:
HTML reports
A structure is produced as shown in this figure.
Grid reports without interleaving
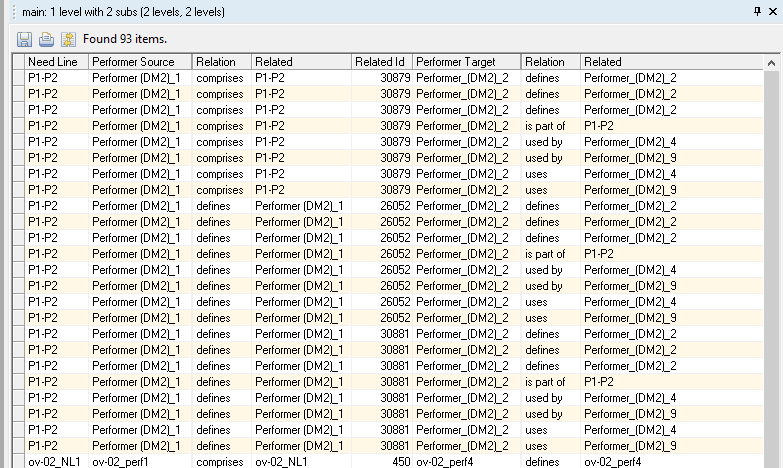
This produces a similar structure while duplicating data where appropriate, like this:
Items produced…
Level 1 Level 2
x a
b
We want:
Level 1 Level 2
x a
x b
Items produced…
Level 1 Subreport started from Level 1
x a
b
We want:
Level 1 Subreport
x a
x b
Items produced…
Level 1 Level 2 Subreport started from Level 1
x a 1
b
We want:
Level 1 Level 2 Subreport
x a 1
x b
Items produced…
Level 1 Level 2 Subreport started from Level 1
x a 1
b 2
3
We want:
Level 1 Level 2 Subreport started from Level 1
x a 1
x b 2
x 3
(because the subreport data is not related to the level-2 data it is incorrect to duplicate that)
The reason for doing this is to give a complete table of data if required and so that the ‘merge cells’ button can be used to identify groupings.
Grid reports with interleaving
There is an Interleave subreport output checkbox in the editor dialog for grid reports. This produces SETTING { INTERLEAVING } in the report script.
The setting for the main report executed dictates the behavior.
This produces a join of subreport output with the parent levels. Sequence of subreports and levels dictates data interleave pattern.
This works for subreports started from the same and from different levels of the main report and from subreports.
Example output…
Main Subreport
x 1
y 2
Produces:
Main Subreport
x 1
x 2
y 1
y 2
Each additional subreport must be processed in the same manner…
Main Subreport 1 Subreport 2
x 1 a
y 2 b
Produces:
Main Subreport 1 Subreport 2
x 1 a
x 1 b
x 2 a
x 2 b
y 1 a
y 1 b
y 2 a
y 2 b
For the example report we get:
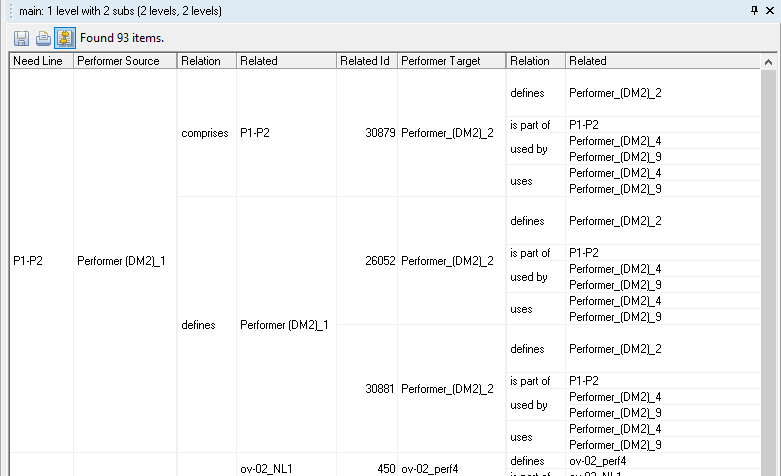
This is the same output after merging cells:
Related topic
Parent topic


