|
Field
|
Description
|
|---|---|
|
Print
|
Click to print the chart.
|
|
Copy
|
Click to copy the chart to the clipboard.
|
|
Refresh
|
Click to refresh the chart with the selected display settings.
|
|
Group By
|
Select an attribute to group the elements based on the selected attribute.
|
|
Sort By
|
Select an attribute to sort the elements according to their attribute values. For text attributes the elements are sorted alphabetically; for integer or float attributes, the elements are sorted by value.
|
|
Sort Order
|
Specify whether the elements are sorted in ascending or descending order.
|
|
Bar Color
|
Specify whether the colors of the bars are determined by the colors of the date attributes or the colors of the choice items. If the choice option is selected, the user can also select a choice attribute from the list.
|
|
Dates
|
Select the date values that are displayed in the Gantt area for each element. You can select more than one date attribute. Click Edit Dates to change the selections. Click Save to save the changes.
|
|
Links
|
Select the link attributes to display the linked elements in the chart. Connectors are displayed between the linked elements.
|
|
Field
|
Description
|
|---|---|
|
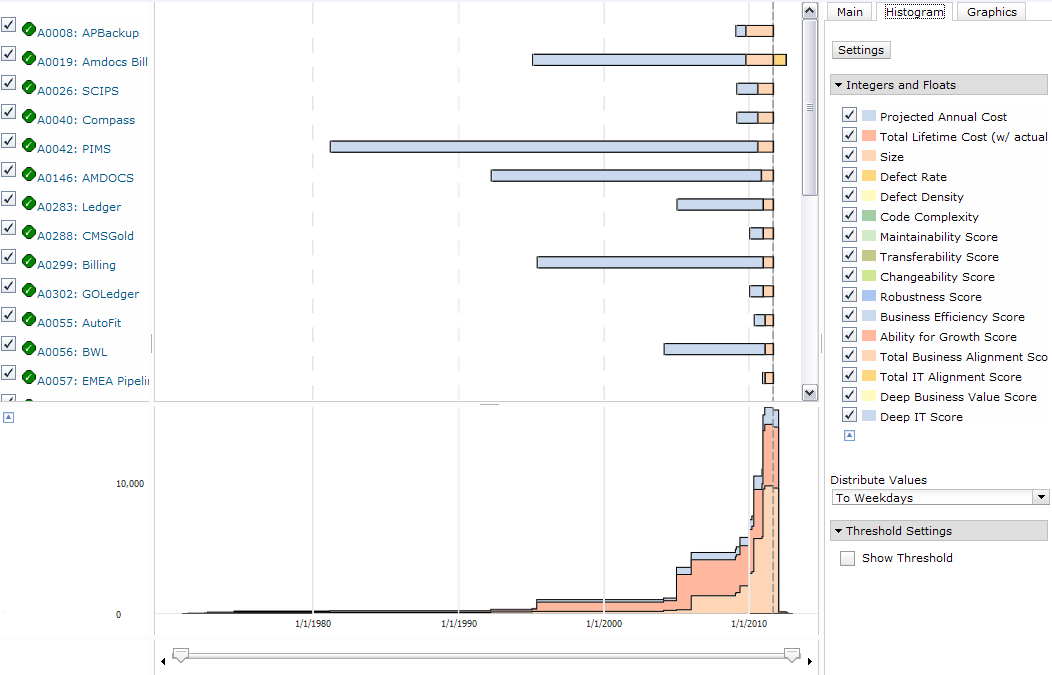
Integers and Floats
|
Select the integer or float attributes to be displayed in the histogram area.
|
|
Distribute Values
|
Enable the check box to configure element value distribution over a period of time. For example, distribute the values over the weekdays.
|
|
Threshold Settings
|
Select Show Threshold to display the threshold values for the elements displayed in the chart. You can specify the values for View, Attribute, Start Date, and End Date.
|
|
Time Grids
|
Display time grid data in a Gantt chart as a histogram of a supply and demand view. A summary of the time grid values of all the elements is displayed in the histogram.
|
|
Field
|
Description
|
|---|---|
|
Chart Settings
|
Select from the available display options: 3D, Hovers, and Grids.
|
|
Time Scale Density
|
Select to display the element position as vertical grid lines. The available options are Low, Medium, and High.
|
|
Gantt Bar Settings
|
Select the settings for the element. Available options are Workspace, Prefix, Icon and Date Icons.
|
