|
Status
|
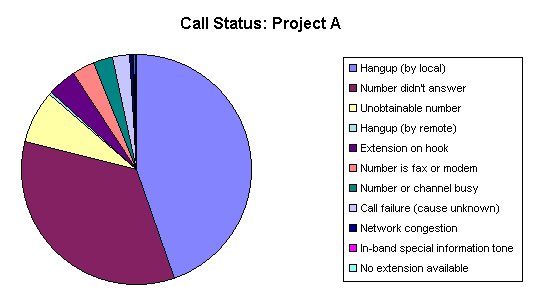
Base
|
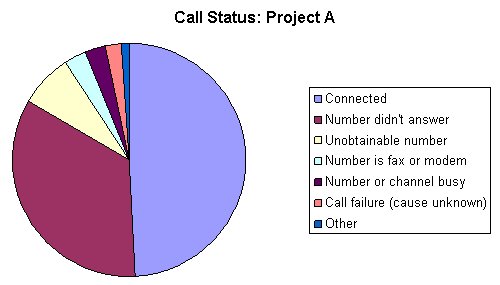
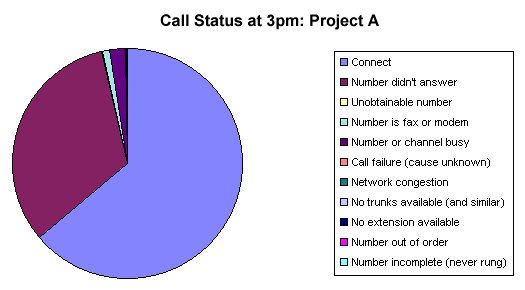
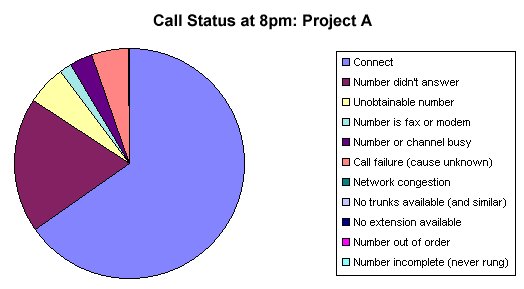
Project A
|
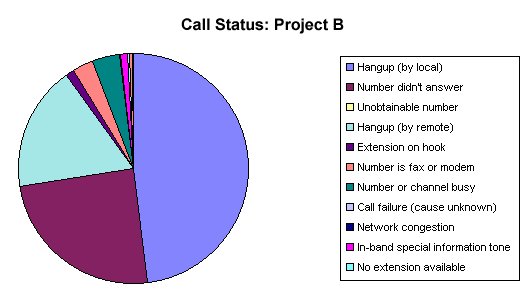
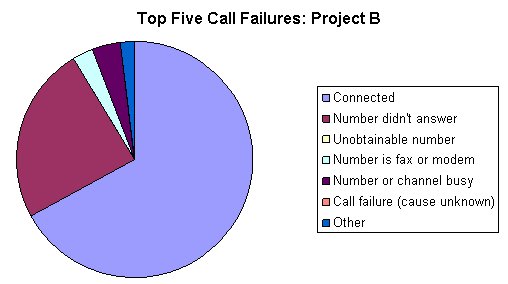
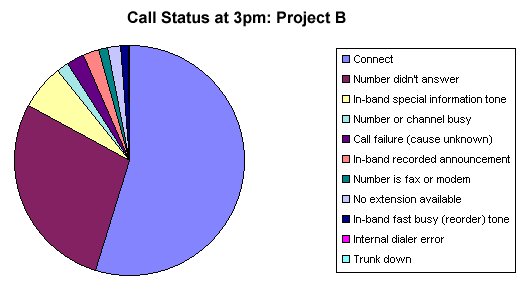
Project B
|
|---|---|---|---|
|
Base
|
485666
100.00%
|
383863
100.00%
|
101803
100.00%
|
|
Hangup (by local)
|
220281
45.26%
|
171392
44.65%
|
48889
48.02%
|
|
Number didn't answer
|
156255
32.17%
|
131401
34.23%
|
24854
24.41%
|
|
Unobtainable number
|
28436
5.86%
|
28436
7.41%
|
–
–
|
|
Hangup (by remote)
|
19739
4.06%
|
1687
0.44%
|
18952
17.73%
|
|
Extension on hook
|
16529
3.40%
|
15335
3.99%
|
1194
1.17%
|
|
Number is fax or modem
|
14926
3.07%
|
11986
3.12%
|
2940
2.89%
|
|
Number or channel busy
|
14458
2.98%
|
10572
2.75%
|
3886
3.82%
|
|
Call failure (cause unknown)
|
9330
1.92%
|
9226
2.40%
|
104
0.10%
|
|
Network congestion
|
1711
0.35%
|
1711
0.45%
|
–
–
|
|
In-band special information tone
|
1159
0.24%
|
62
0.02%
|
1097
1.08%
|
|
No extension available
|
812
0.17%
|
631
0.16%
|
181
0.18%
|
|
No trunks available (and similar)
|
703
0.14%
|
703
0.18%
|
–
–
|
|
In-band recorded announcement
|
566
0.12%
|
110
0.03%
|
456
0.45%
|
|
Number incomplete (never rung)
|
386
0.08%
|
287
0.07%
|
99
0.10%
|
|
Number out of order
|
321
0.07%
|
321
0.08%
|
–
–
|
|
In-band fast busy (reorder) tone
|
51
0.01%
|
–
–
|
51
0.05%
|
|
Call rejected
|
2
*
|
2
*
|
–
–
|
|
Internal dialer error
|
1
*
|
1
*
|
–
–
|