Creating axis expressions and exporting to IBM SPSS Statistics
In UNICOM Intelligence Reporter - Survey Tabulation and the UNICOM Intelligence Professional Tables Option, you can use numeric, text, and date variables in your tables by defining an axis specification that bands or codes the values into categories. You can define the axis specification for a variable at the time you create the table. Elements added in this way are not saved in the metadata. For more information, see
Working with numeric variables.
Alternatively, you can save the axis specification in the metadata, and it is used by default when you subsequently create a table for the variable in UNICOM Intelligence Reporter - Survey Tabulation or using a table script. Axis specifications that are saved in the metadata are sometimes called axis expressions. You can use data management scripts to set up axis specifications for variables for use in UNICOM Intelligence Reporter - Survey Tabulation and UNICOM Intelligence Professional Tables Option.
Here is a Metadata section that defines axis expressions for some variables that already exist in the input data source. In this example, the axis expressions are presented on multiple lines for clarity. In practice you must specify the axis specification without line breaks.
Metadata (enu, Analysis, Label, Input)
' Autocode a text variable
address text
axis("{London 'London' expression('address.find(""london"") <> -1'),
Liverpool 'Liverpool' expression('address.find(""liverpool"") <> -1'),
Aberdeen 'Aberdeen' expression('address.find(""aberdeen"") <> -1'),
Leeds 'Leeds' expression('address.find(""leeds"") <> -1'),
Edinburgh 'Edinburgh' expression('address.find(""edinburgh"") <> -1'),
OtherCities 'Other cities' expression('address.find(""london"") = -1
And address.find(""liverpool"") = -1
And address.find(""aberdeen"") = -1
And address.find(""Leeds"") = -1
And address.find(""Edinburgh"") = -1
And Not address.IsEmpty()'),
NotAnswered 'Not answered' expression('address.IsEmpty()')}");
' Band a numeric variable
visits long
axis ("{visits1 '1 to 10' expression('visits > 0 And visits < 11'),
visits2 'More than 10' expression('visits > 10'),
mean 'Mean' mean(visits)}");
' Summarize a numeric variable
adults long
axis ("{min 'Minimum' min(adults),
max 'Maximum' max(adults),
mean 'Mean' mean(adults),
StdDev 'Standard deviation' StdDev(adults)}");
' Band a numeric variable
human long
axis ("{NotAtAll 'Not at all interested' expression('human = 1'),
NotParticularly 'Not particularly interested' expression('human = 2'),
NotOpinion 'No opinion' expression('human = 3'),
Slightly 'Slightly interested' expression('human = 4'),
Very 'Very interested' expression('human = 5'),
'Mean' mean(human)}");
End Metadata
When defining axis expressions in the Metadata section, do not include the variable name, just specify the element list syntax. For more information on defining axis expressions in mrScriptMetadata, including information on when to use single quotation marks and when to use two double quotation marks, see
Axis expressions in the UNICOM Intelligence Developer Documentation Library. For information about the element list syntax, see
Element list syntax.
You can create tables for these variables in your table script, just like you can for categorical variables. For example, the TablesDefineAxes.dms sample exports the data to a .sav file and includes a Metadata section similar to the one shown above and the following OnAfterJobEnd Event section. This has a CreateTables Sub procedure, which creates tables for the text and numeric variables for which axis expressions are defined in the Metadata section.
Event(OnAfterJobEnd, "Create tables")
Dim TableDoc
Set TableDoc = dmgrJob.TableDocuments["SavOutput"]
' Create tables for simple variables
CreateTables(TableDoc, TableDoc.DataSet.MDMDocument.Fields)
Sub CreateTables(TableDoc, Fields)
Dim Field
' Create tables for the simple categoricals
' and any other simple variables that have an axis expression
For Each Field In Fields
Select Case Field.ObjectTypeValue
Case ObjectTypesConstants.mtVariable
If Field.DataType = mr.Categorical Then
' It's a categorical variable - add a new table
TableDoc.Tables.AddNew("Table" + CText(TableDoc.Tables.Count + 1), _
Field.FullName + " * gender", Field.Label)
ElseIf Field.AxisExpression.IsEmpty() = False Then
TableDoc.Tables.AddNew("Table" + CText(TableDoc.Tables.Count + 1), _
Field.FullName + " * gender", Field.Label)
End If
Case ObjectTypesConstants.mtClass, ObjectTypesConstants.mtCompound
If Field.IsSystem = False Then ' Exclude system variables
CreateTables(TableDoc, Field.Fields)
End If
End Select
Next
End Sub
' Populate the tables
TableDoc.Populate()
' Export the tables
With TableDoc.Exports["mrHtmlExport"]
.Properties["Interactive"] = True
.Properties["LaunchApplication"] = True
.Properties["PresentationStyle"] = "Black and White"
.Export("C:\Program Files\IBM\SPSS\DataCollection\7\DDL\Output\TablesDefineAxes.htm")
End With
End Event
Because IBM SPSS Statistics has different variable naming rules from the UNICOM Intelligence Data Model, the variable names used in the .sav file are often different from those in the input data source. In addition, sometimes several variables are created in the .sav file for a single variable in the input data source. When you export data to IBM SPSS Statistics, it is always best to save the output metadata in a .mdd file and always use this when creating tables. Here is the OutputDataSource section from the TablesDefineAxes.dms sample, showing that a .mdd file has been specified in the MetaDataOutputName parameter:
OutputDataSource(SavOutput)
ConnectionString = "Provider=mrOleDB.Provider.2; _
Data Source=mrSavDsc; _
Location=C:\Program Files\IBM\SPSS\DataCollection\7\DDL\Output\TablesDefineAxes.sav"
MetaDataOutputName = "C:\Program Files\IBM\SPSS\DataCollection\7\DDL\Output\TablesDefineAxes.mdd"
End OutputDataSource
When you access the .sav file using the .mdd file, you can use the familiar input data source variable names in your script rather than the .sav file variable names. In addition, you can ignore any differences in variable structure, because the UNICOM Intelligence Data Model automatically recombines variables that have been split into multiple variables in the .sav file. For example, when you run the TablesDefineAxes.dms sample in UNICOM Intelligence Data Model 2.9 or earlier, five variables (called address1 through address5) are created in the .sav file from the address text variable in the input data. This is because the address variable can contain up to 1024 characters, but .sav file text variables have a limit of 255 characters in IBM SPSS Statistics 12 and earlier. However, provided you use the .mdd file when creating your tables, you can access these five variables as if they were one variable called address.
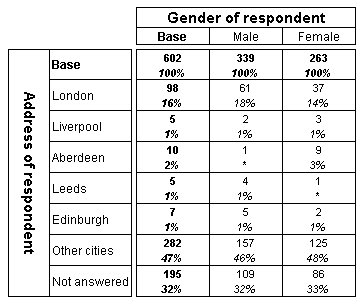
Here is the table created for the address variable by the script:
The axis specification for the address variable is defined by the axis expression defined in the Metadata section.
Note The examples in this topic are available in a sample file (called
TablesDefineAxes.dms) that comes with the UNICOM Intelligence Developer Documentation Library. For more information, see
Table scripting sample Data Management scripts.
See also

