Working with numeric variables
Sample script file: NumericVariables.mrs
If you have worked through the examples in this section methodically, you may have noticed that all of the variables that we have used up to now in our tables have been categorical variables. However, you can also use numeric variables if the variable has an axis specification defined for it in the metadata, or if you create an axis specification that summarizes the variable or bands it into categories.
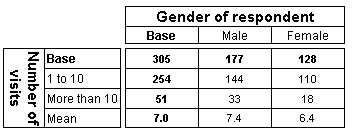
Table showing visits by gender, with visits banded into two categories and additional mean row
For example, the visits variable in the Museum data set is a numeric variable that records the number of times respondents have visited the museum before. This example creates an axis specification for this variable, containing two elements that use expressions to group the numeric values into categories and a special statistical element to show the mean value.
TableDoc.Tables.AddNew("Table1", _
"visits{visits1 '1 to 10' expression('visits > 0 And visits < 11'), "_
+ "visits2 'More than 10' expression('visits > 10'), " + _
"mean 'Mean' mean(visits)}" + _
"* gender", "Number of visits by Gender")
Here is the table produced by the script:
Just like creating a filter, when you use an expression element to band a numeric variable, you can use any expression that is supported by the UNICOM Intelligence Data Model, including functions in the UNICOM Intelligence Function Library.
For information about the functions that come with the UNICOM Intelligence Data Model, see
UNICOM Intelligence Function LibraryFor examples of using the operators, see
Comparison operators.
Next
See also

