Table 1: Top-level variables tabulated at the top level
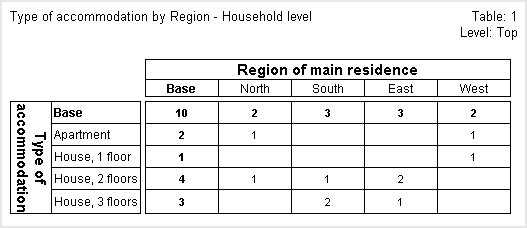
The first table crosstabulates two top-level variables (housetype and region) and generates results at the top level. The counts in the cells refer to households because in this survey the top-level questions refer to households.
To create this table, add the housetype variable to the side of the table and the region variable to the top. Use the default level setting (Top).
Top-level variables tabulated at the top level
The cell in the top left corner of the table shows that there are 10 households in the sample.
See also