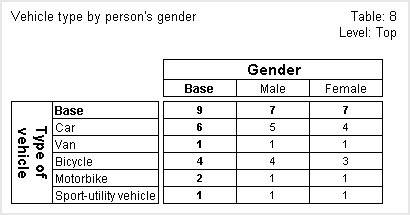
The next table crosstabulates a variable from the vehicle level (
vehicletype) with a person-level variable (
gender). The diagram of the levels structure of
The Household sample shows that the person and vehicle levels are parallel to each other (on different branches of the tree). This means that the data at the two levels is not directly related to each other. It would therefore make no sense to generate results at either the person or vehicle level and so this is not allowed. However, you can generate results at a higher level that is an ancestor of both of them. In this example, the only level that is an ancestor of both the person and vehicle levels is the top level. Each cell therefore shows the number of
households that have the various types of vehicles and that contain people of the given gender.