Chart types
You can select a chart type for an individual table using the Chart tab in the Table Properties dialog box. If you do not specify a chart type, the default chart type is used (this depends on the type of table, but in most cases is a Clustered Bar chart). When you export your results, you can select a chart type to use for the export. This becomes the default chart type for any tables for which no chart type is specified. It does not override chart types you have selected for individual tables using the Chart tab.
When you export charts to Microsoft Excel, PowerPoint, or Word, you can export the charts to a user-defined custom chart type that you have set up in Excel. See
Exporting charts using Microsoft Excel custom chart types for more information.
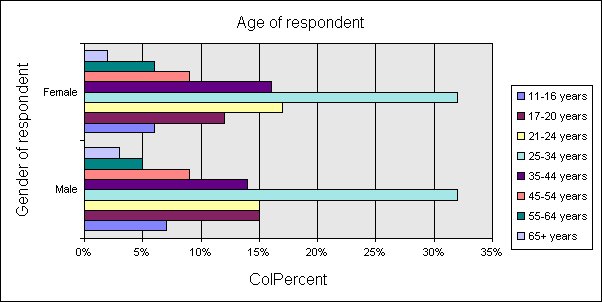
Clustered bar chart example
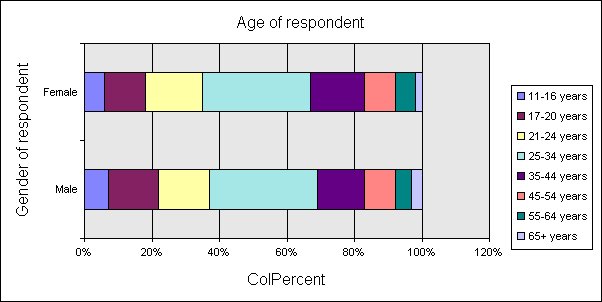
Stacked bar chart example
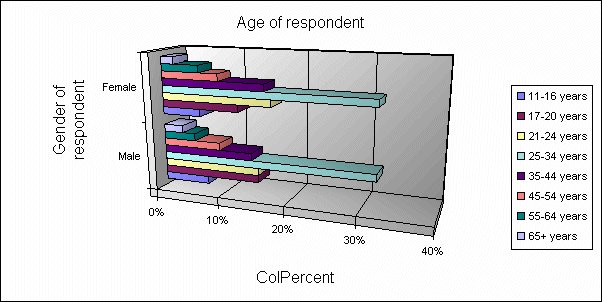
3D clustered bar chart example
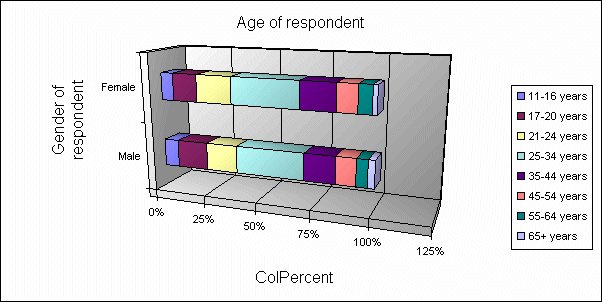
3D Stacked bar chart example
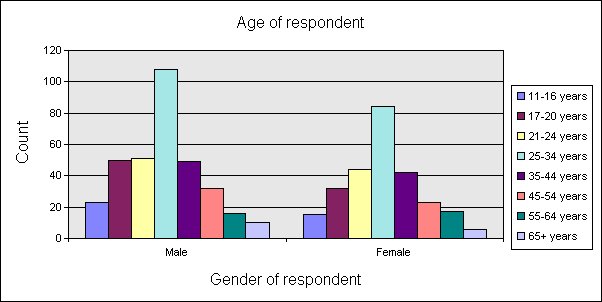
Clustered column chart example
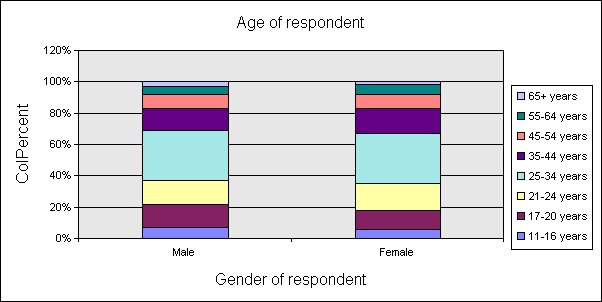
Stacked column chart example
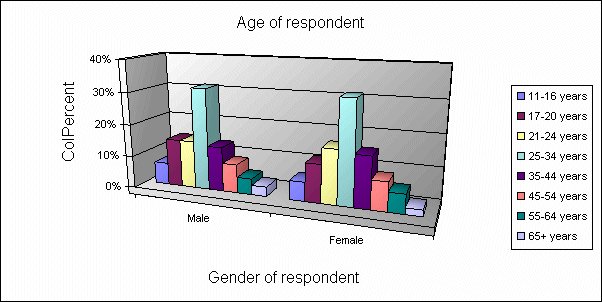
3D clustered column chart example
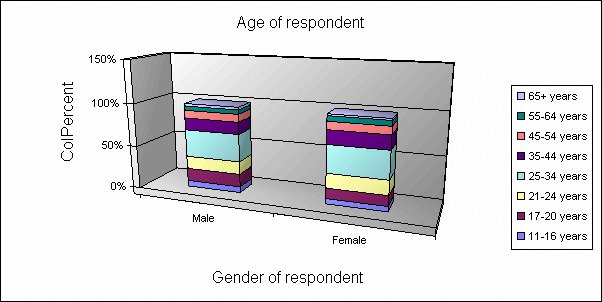
3D stacked column chart example
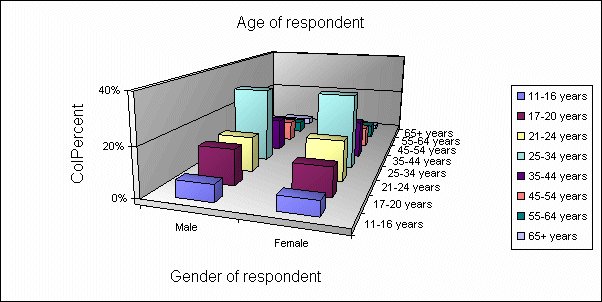
3D column chart example
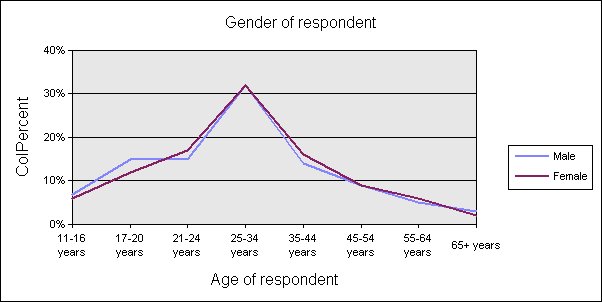
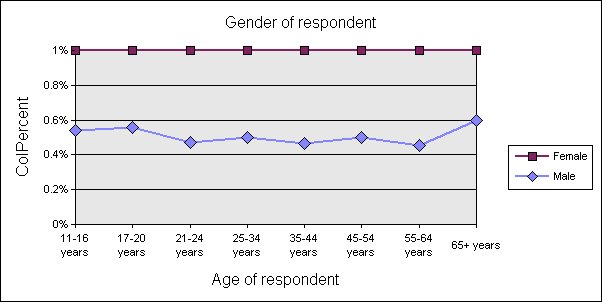
Line chart example
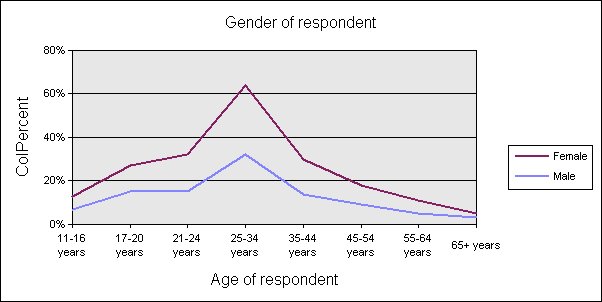
Stacked line chart example
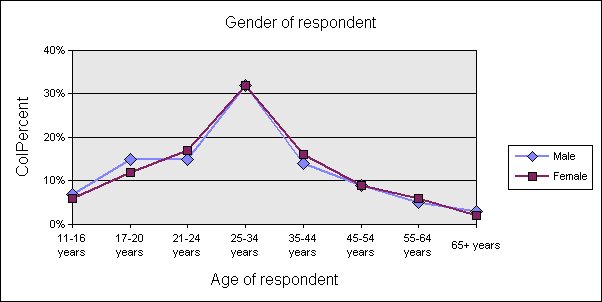
Line chart with markers example
100% stacked line chart with markers example
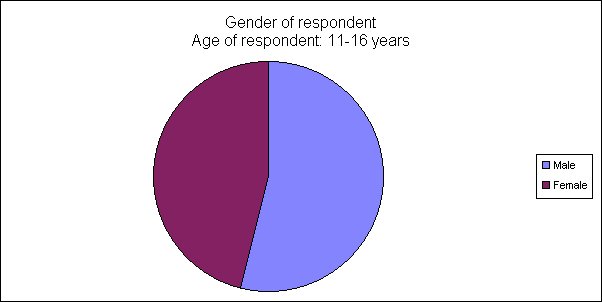
Pie chart example
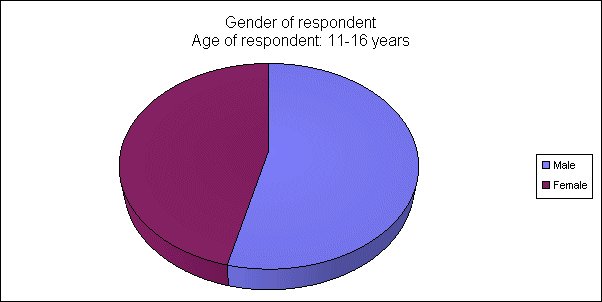
3D pie chart example
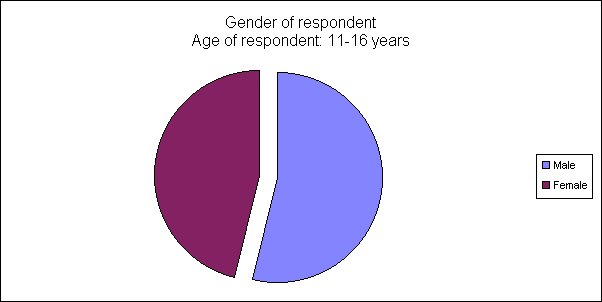
Separated pie chart example
3D separated pie chart example
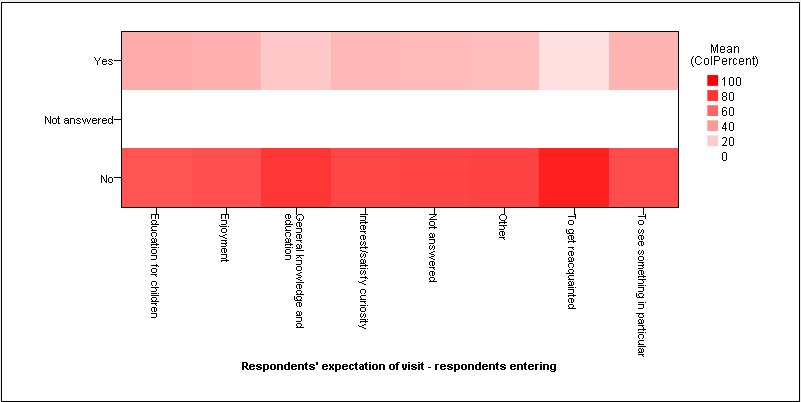
Heat Map example
See also