Example of Fisher's exact test
Sample script file: ChiSquareAndFisherTests.mrs
This example script is based on the Museum sample data set.
This example tests whether having a biology qualification has any influence over whether respondents prefer the dinosaurs exhibit or the human biology exhibit. In a simple table of biology by prefer, the results appear to show that most people with no biology qualification prefer dinosaurs, whereas people with a biology qualification display no particular preference between dinosaurs and human biology. As this information is contained in two rows and two columns, you can apply Fisher's exact test to determine whether this difference is significant or simply the result of chance.
Here is the script to add the test to the table:
TableDoc.Table2.Statistics.Add("Fisher")
Note that although the table of biology by prefer contains three rows and two columns, is able to apply Fisher's exact test because it detects that only two rows and two columns contain data and so the table meets the requirements of this test.
Table showing Fisher's exact test
The resulting table has an additional Fisher Exact row below the rows formed from the categories of the biology variable. Similarly, an additional ChiSq column appears to the right of the columns formed from the categories of the prefer variable. The cell formed by the Fisher Exact row and the ChiSq column displays the value returned by the test, which is the exact p value for the table. In this table, the value is 0.021, which indicates that there is approximately a 2% probability of the results in this table occurring by chance, and therefore a 98% percent probability that the apparent difference in preference between those with and those without a biology qualification is statistically significant.
Chi-square test and Fisher's exact test
You can apply both the chi-square test and Fisher's exact test to the same table. For example, you may decide to apply both tests on a table with several sections so that Fisher's exact test will display an exact p value in those sections where it is possible to do so, while the value for the chi-square test will still be available in the other sections of the table.
Here is the script to add the tests to the table:
TableDoc.Table3.Statistics.Add("ChiSquare")
TableDoc.Table3.Statistics.Add("Fisher")
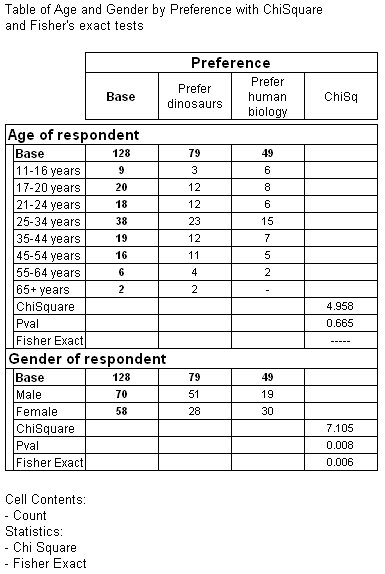
In this table the top section has more than two rows and is therefore unsuitable for Fisher's exact test, so only the chi-square result is calculated. The bottom section has two rows and two columns of data, so the results for both Fisher's exact test and the chi-square test are displayed.
Table showing chi-square and Fisher's exact tests
See also


