Statistical formula for the column proportions test
The column proportions test is performed separately for each relevant pair of columns within each relevant row and so the formula is presented in terms of one row and one pair of columns.
|
Notation
|
Description
|
|
Weighted base in column i
|
|
Sum of squared weights for column i
|
|
Weighted count in this row for column i
|
|
Weighted base for the overlap
|
|
Sum of squared weights for the overlap
|
|
Count in this row for the overlap
|
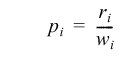
The proportion in each column i is
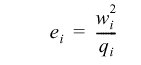
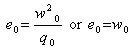
If the effective base is being used, the effective base in each column i is
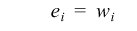
Otherwise
The test is not performed if:
▪w i <= 0
▪The effective base is being used and q i <= 0
▪The proportions in the two columns being tested are identical
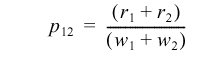
The combined proportion for a pair of columns, 1 and 2, is
The covariance term, v, and the effective base, e o, are both set to 0 if:
▪The data are not overlapping
▪The data are overlapping and w o <= 0
▪The data are overlapping and the effective base is being used and q o <= 0
Otherwise
With overlap, Z always reduces to a value of 1.0, except in the case of grids.
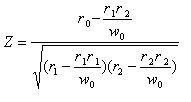
For grids, the formula for Z is:
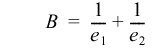
Where:
r0 = the count for this row in the overlap
r1 = the count for this row in column 1 for respondents in both columns
r2 = the count for this row in column 2 for respondents in both columns
and w0 is the base in the overlap, that is, the number of respondents who were asked both columns.
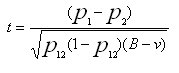
The t value is calculated as
where:
If required, the continuity correction option can be applied using the property:
Statistics["ColumnProportions"].Properties["UseContinuityCorrection"] = True
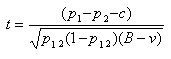
If the option to include the continuity correction is used, the t value is calculated as
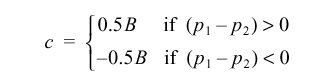
where c is the continuity correction,
The degrees of freedom, DF, are
DF = e1 + e2 - e0 - 2
The absolute value of t together with the degrees of freedom are used to calculate the probability, p, for the t value. If p is less than the significance level requested, the proportions in the two columns are deemed to be significantly different.
See also