Statistical formula for the column means test
The column means test is performed separately for each relevant pair of columns within a row that contains mean values and so the formula is presented in terms of one row and one pair of columns.
|
Notation
|
Description
|
|
Weighted count of cases contributing to the mean in column i.
|
|
Sum of squared weights for column i.
|
|
Weighted count of cases contributing to the mean for the overlap.
|
|
Sum of squared weights for the overlap.
|
|
Weighted sum of the values in column i.
|
|
Weighted sum of the squared values in column i.
|
The mean in each column i is
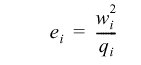
If the effective base is being used, the effective base in each column i is
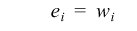
Otherwise
The test is not performed if:
▪w i <= 0
▪The effective base is being used and q i <= 0
▪The mean values in the two columns being tested are identical
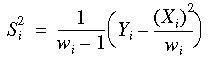
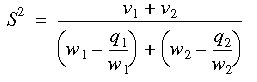
The sample variance in column i is
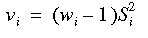
If we set
Then the pooled estimate of the population variance is
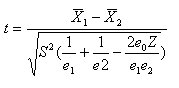
The t value is:
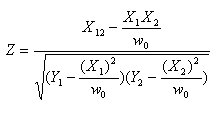
With no overlap, Z and e o are both zero. With overlap, Z is 1.0, except in the case of grids, where it is:
where:
▪X12 is the weighted sum, for respondents in both columns, of the value in column 1 multiplied by the value in column 2
▪all X and Y terms in Z refer to respondents who are in both columns.
The degrees of freedom, DF, are
DF = e1 + e2 - e0 - 2
See also