Example of the T-test test
Sample script file: TTestTests.mrs
This example script is based on the Museum sample data set.
The T-test test in this example determines whether:
▪The number of visits in the last twelve months is significantly different from zero for each category in age.
▪The total number of visits is significantly different from six for each category in age.
▪The difference in numeric rating values for dinosaurs and mammals is significantly different from zero for each category in age.
▪The entrance rating for fossils is significantly different from zero, once the factors have been reset from (1 to 5) to (-2 to 2), for each category in age.
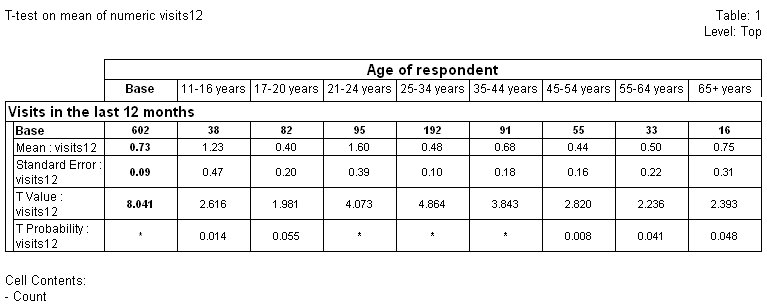
The first test determines if the number of visits in the last twelve months is significantly different from zero for each category in age.
The script creates a table with visits12 on the side axis and age on the top axis:
Set Tab = TableDoc.Tables.AddNew("T1", _
"axis({base(), _
mean(visits12) [Decimals=2], _
stderr(visits12) [Decimals=2], _
tvalue(visits12), _
tprob(visits12)}) _
* age", _
"T-test on mean of numeric visits12")
Tab.Side.SubAxes[0].Label = "Visits in the last 12 months"
The second test determines if the total number of visits is significantly different from six for each category in age.
The script creates a table with visits6 on the side axis and age on the top axis:
Set Visits6 = MdmDoc.CreateVariable("visits6", "Visits minus 6")
MdmDoc.Fields.Add(Visits6)
Visits6.DataType = 1 ' Long
Visits6.SourceType = 2 ' Expression
Visits6.Expression = "visits - 6"
Set Tab = TableDoc.Tables.AddNew("T2", _
"axis({base(), _
mean(visits6) [Decimals=2], _
stderr(visits6) [Decimals=2], _
tvalue(visits6), _
tprob(visits6)}) _
* age", _
"T-test on mean of derived numeric (visits - 6)")
Tab.Side.SubAxes[0].Label = "Visits minus 6"
The third test determines if the difference in numeric rating values for dinosaurs and mammals is significantly different from zero for each category in age.
The script creates a table with dinmam on the side axis and age on the top axis:
Set Dinmam = MdmDoc.CreateVariable("dinmam", "Dinosaurs minus mammals")
MdmDoc.Fields.Add(Dinmam)
Dinmam.DataType = 1 ' Long
Dinmam.SourceType = 2 ' Expression
Dinmam.Expression = "dinosaurs - mammals"
Set Tab = TableDoc.Tables.AddNew("T3", _
"axis({base(), _
mean(dinmam) [Decimals=2], _
stderr(dinmam) [Decimals=2], _
tvalue(dinmam), _
tprob(dinmam)}) _
* age", _
"T-test on mean of derived numeric (dinosaurs - mammals)")
Tab.Side.SubAxes[0].Label = "dinosaurs - mammals"
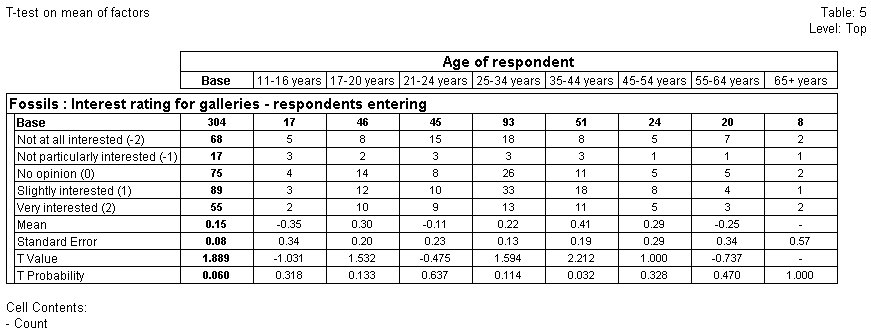
The fourth test determines if the entrance rating for fossils is significantly different from zero, once the factors have been reset from (1 to 5) to (-2 to 2), for each category in age.
The script creates a table with rating_ent[{fossils}] on the side axis and age on the top axis:
Set Tab = TableDoc.Tables.AddNew("T5", _
"rating_ent[{fossils}].column{.., _
mean() [Decimals=2], _
stderr() [Decimals=2], _
tvalue(), _
tprob()} _
* age", _
"T-test on mean of factors")
Set Ax = Tab.Side.SubAxes[0]
Set El = Ax.Elements["Not_at_all_interested_1"]
El.Label = "Not at all interested (-2)"
El.Factor = -2
Set El = Ax.Elements["Not_particularly_interested_2"]
El.Label = "Not particularly interested (-1)"
El.Factor = -1
Set El = Ax.Elements["No_opinion_3"]
El.Label = "No opinion (0)"
El.Factor = 0
Set El = Ax.Elements["Slightly_interested_4"]
El.Label = "Slightly interested (1)"
El.Factor = 1
Set El = Ax.Elements["Very_interested_5"]
El.Label = "Very interested (2)"
El.Factor = 2
See also


