Diagnostics information: Column proportions test
When you run a statistical test on a table, UNICOM Intelligence Reporter can create diagnostics information that shows the
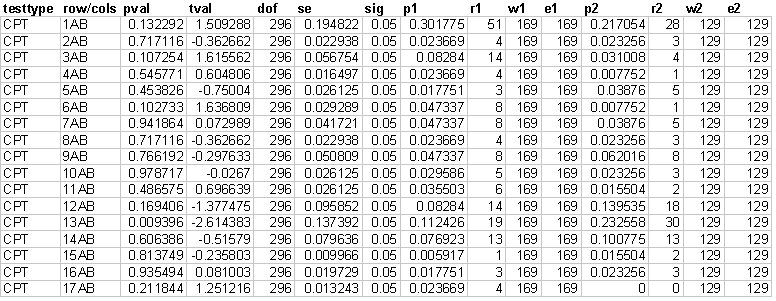
p values and some of the intermediate figures used to calculate the statistics. The information is in comma‑delimited format, so you can open it in Microsoft Excel and perform calculations on the data. The information varies according to the test. Here is the information for the first
column proportions test example:
Tstats for table 'Table2' layer 1: overlap not specified: unweighted: effective base used
row/cols
This is in the form nxy, where n represents the category row (the first category row is 1, the second category row is 2, and so on.) and x and y are the IDs of the pair of columns.
pval
The p value.
tval
The t value.
dof
The degrees of freedom.
se
The standard error.
sig
The significance level chosen for the test.
p1, p2
The proportions in the two columns.
r1, r2
The counts in the two cells. If the table is weighted, these are weighted.
w1, w2
The bases in the two columns. If the table is weighted, these are weighted.
e1, e2
The effective base in the two columns. These are the same as the bases if the effective base option was not used.
See also