Adding and nesting variables
When you add a second or subsequent variable to the side or top of a table, you can either add the variables or nest them.
Adding variables
In the Variables pane, drag a variable to the Add button in the Design pane.
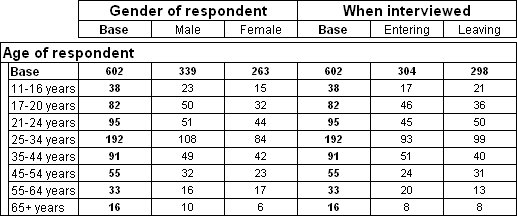
Adding variables simply displays one variable after another on the table, as though they are separate tables in the same display. For example, here is a table in which two variables (gender and interview) are added to the top of a table:
Nesting variables
In the Variables pane, drag the variable to the Nest button in the Design pane.
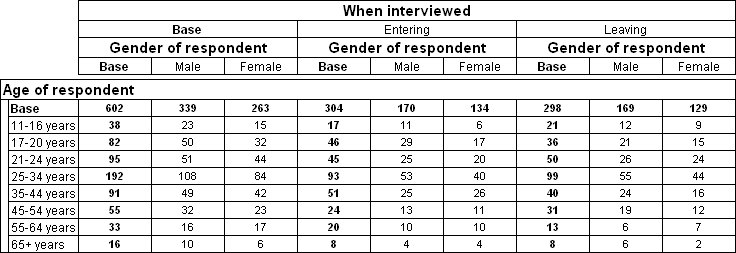
Nesting variables provides a breakdown of detail. When you nest variables, the categories of the inner variable are displayed for each category of the outer variable. Here is a table that has the same two variables on the top as in the previous table, but this time gender is nested within the interview variable:
Whether you choose to add variables or nest them depends on what kind of analysis you want. The first table shows the number of male and female respondents and their age breakdown and the number of people interviewed entering and leaving the museum and their age breakdown. However, it does not show the gender breakdown of the respondents interviewed entering and leaving the museum. For that you need to nest the gender variable within the interview variable (which records whether respondents were interviewed entering or leaving the museum) as shown in the second table.
See also