Creating summary statistic or summary means tables
You may find it useful to summarize a number of different numeric variables in a single table. You can create a summary table by selecting the numeric variables that you want to summarize and then using the Summary Statistics Table dialog box to select the statistics that you want to see.
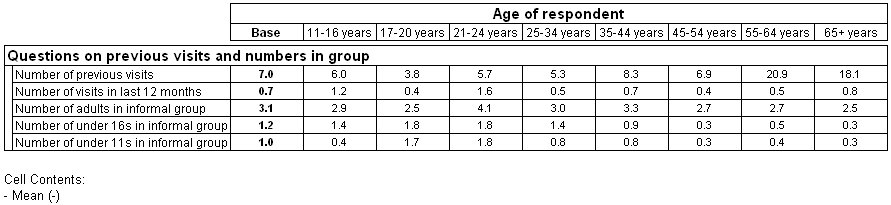
For example, the following table summarizes five questions (visits, visits12, adults, under16s, and under11s) that were asked in the original Museum survey, dealing with respondents' previous visits and the numbers of people of different ages in their group during the current visit. It shows the mean values for each of these questions, tabulated by age of respondent.
This example shows a summary table that provides the mean value for each variable by using a mean cell item. See:
You can produce other types of summary statistic tables for any cell item that can be based on a numeric variable, for example, maximum, minimum, or standard deviation. For a full list, see the
Summary Statistic Table dialog box.
See also