Displaying the mean of a numeric variable
Sample Script File: SpecialElements.mrs
This example script is based on the Museum sample data set. See
Running the sample table scripts for information on running the example scripts.
age{.., mean(visits)}
This creates an axis based on all of the elements in the age variable with the addition of a special element that shows the mean value of the visits variable. This variable stores the number of previous visits that respondents have made to the museum. Therefore this element shows the mean number of previous visits that respondents have made to the museum.
Note that this example does not specify a label for the special element, so the default label is used. The default label has the form "Mean : <variable name>". The next example shows you how to override the default label with a custom label.
Displaying the mean of a numeric variable with a custom label
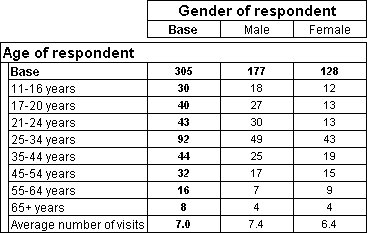
age{.., meanvisits 'Average number of visits' mean(visits)}
This is similar to the previous example, except that it creates a custom label for the mean element. When you specify a custom label, you need to enclose the label text in single quotation marks ('<label text>') or in two double quotation marks (""<label text>""). If you use single quotation marks, you must escape any single or double quotation marks included in the label with a second quotation mark of the same type. This indicates that the quotation mark used in the label does not represent the end of the label. If you use two double quotation marks, you need to escape any double quotation marks used in the label with three double quotation marks.
Here is a table that has this axis on the side:
See also

