Displaying a mode
Sample Script File: SpecialElements.mrs
This example script is based on the Museum sample data set. See
Running the sample table scripts for information on running the example scripts.
This example is based on the Museum sample data set.
You can add a row or column on a table to display the most frequently occurring value or mode. In UNICOM Intelligence Professional, where there is more than one mode value, the lowest is displayed.
visits{base(), mode(visits)}
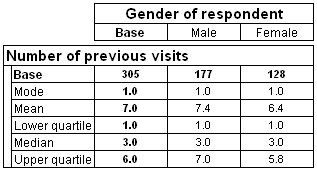
This example displays a mode, together with a mean, median, and two percentiles, for the visits variable.
visits{base(), mean 'Mean' mean(visits), mode 'Mode' mode(visits), percentile25 'Lower quartile' percentile(visits,25), median
'Median' median(visits), percentile75 'Upper quartile' percentile(visits,75)}
Here is a table that has this axis on the side:
For information on how to display medians and percentiles as cell items rather than as rows or columns of a table, see
Cell contents.
See also