Grid and loop slices
Sample script file: GridAndLoopSlices.mrs
This example script is based on the Household sample data set. See
Running the sample table scripts for information on running the example scripts.
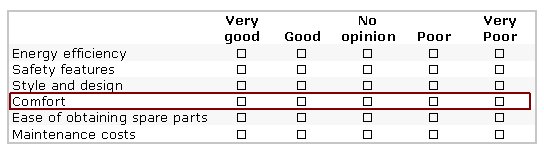
Sometimes you may want to tabulate the results of one iteration of a grid or loop against another variable. Using an iteration of a grid or loop is sometimes called a grid or loop
slice. For example, continuing with the vehicle rating example grid used in the
Grid tables topic, you may want to tabulate the rating that respondents gave to the vehicle's comfort by another variable (such as the vehicle type). Here is the grid question with the comfort slice highlighted:
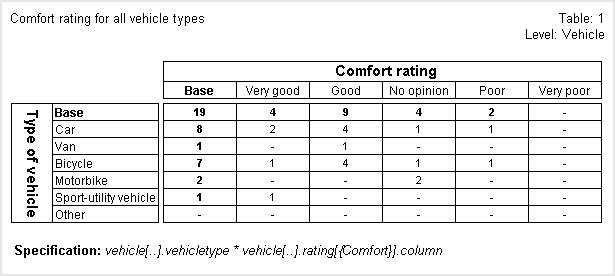
In your table specification, you specify a grid or loop slice by including the iteration ID in the full name of the variable. In this example, the vehicle rating grid is a categorical loop, so the iteration ID is the category name (enclosed in braces):
TableDoc.Tables.AddNew("Table1", "vehicle[..].vehicletype * " + _
"vehicle[..].rating[{Comfort}].column", _
"Comfort rating for all vehicle types")
Here is the table:
Notice that in this table, the label for the rating axis says “Comfort rating” rather than just “Rating”. This could be achieved by changing the label of the axis like this:
TableDoc.Table1.Top.SubAxes[ _
"vehicle.rating[{Comfort}].column"].Label = "Comfort rating"
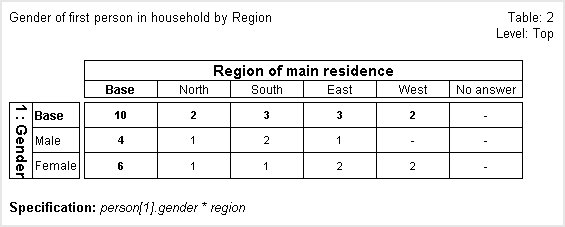
In a numeric loop, the iteration ID is a numeric value. For example, suppose you want to tabulate the gender of the first person in each household by the region. You would specify the iteration ID as 1 in the full name of the gender variable:
TableDoc.Tables.AddNew("Table2", "person[1].gender * region", _
"Gender of first person in household by Region")
Notice that in this table, the label for the Gender axis is “1: Gender”. When you create an axis from a slice of a grid or loop, the full label is used instead of the standard label. This makes it clear which slice is being used, because, by default, the full label is the label prefixed by the iteration name. However, it is possible to customize the full label by defining text substitutions in a variable's label. For example, instead of manually setting the axis label to “Comfort rating” in the first table, we could achieve the same result by setting the label on the variable to “\+loop2\- rating” like this:
TableDoc.DataSet.MdmDocument.Fields["vehicle.rating[..].column"]_
.Label = "\+loop2\- rating"
This uses the
\+loop2\- insertion text, which inserts the label of the current iteration into the full label. For more information, see
Full labels.
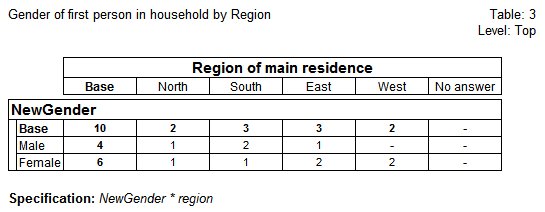
Grid and loop slices can also be used to create derived variables. For example, the following creates a derived variable based on person[1].gender:
Set Vars = TableDoc.DataSet.Variables
Vars.AddNewVariable("!
NewGender categorical
expression("person[1].gender");
!")
The variable is tabulated as follows:
.AddNew("Table3", "NewGender * region", _
"Gender of first person in household by Region")
The resulting table is similar to Table2.
The restrictions on using a grid and loop slice are similar to those for grid tables. The grid or loop must be defined as expanded and have at least one iteration. In MDM terms, this is any Grid or Array object of type mlExpand that has at least one Element object. (The MDM creates the Element objects for an expanded numeric loop automatically.) This means that you cannot create this table in the Quanvert museum sample because the person loop is not defined as expanded. However, you can create this table in the XML data set, because the person loop is defined as expanded (the Array object is of type mlExpand) in the Household.mdd file.
Setting the population level explains that generally the default population level for a table is the lowest common ancestor level of all the filters and variables that are included in the table (including variables used in the cell contents). However, when a table contains a grid slice at a lower level than any other variable included in the table, the default level will be the level
above the grid slice. This is because, when tabulating a grid slice, it is more common to want to show the number of cases at the next level up rather than the number of responses at the grid level. However, you can choose to populate the table at the level of the grid slice if necessary.
See also