Professional > Table scripting > Statistical tests > Tukey test > Statistical formula for the Tukey test
 
Statistical formula for the Tukey test
The following table shows the notation used in this topic.
Notation
Description
Number of levels for an effect.
j-th observation at i-th level.
Harmonic mean of the sample size.
Number of observations at level i, i=1,...,k.
Mean at level i, i=1,...,k.
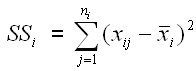
Sum of squares at level i, i=1,…k.
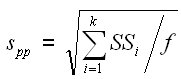
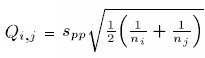
Pooled standard deviation from all levels.
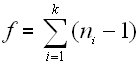
Degrees of freedom for the within-groups mean square.
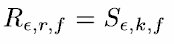
Experimentwise error rate under the complete null hypothesis.
Number of steps between means.
The upper-ε critical point of the Studentized range distribution.
Range values
for all values of r.
When finding the critical value R ε,r,f for any pair of means r columns apart, the value S ε,k,f is always used where k is the total number of columns. The lookup table for ε is queried to find the value in the appropriate row for f and the appropriate column for k, regardless of the value of r.
The confidence intervals of the mean difference are calculated using Q i,j instead of Q h.
For all pairs of means
For any two means i and j being tested
Constructing homogeneous subsets
Note Homogenous subsets are only available via diagnostics (see Diagnostics information: Tukey test).
The outermost pair of means have a significant range if:
If so, test whether:
Once a whole set is found to be nonsignificant testing stops.
Each time a range proves nonsignificant, the means involved are included in a single group (homogeneous subset). This mean that the columns within a nonsignificant range should be combined into a single column and the test reapplied with the collapsed sets of columns.
Multiple comparisons test for all possible pairs
for all i < j.
See also
Tukey test