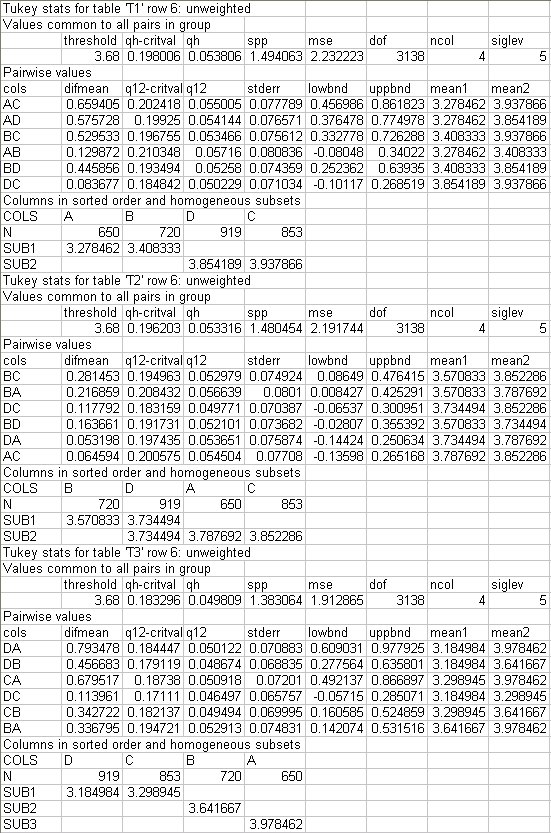
Diagnostics information: Tukey test
When you run a statistical test on a table, UNICOM Intelligence Professional can create diagnostics information that shows and some of the intermediate figures used to calculate the statistics. The information is in comma-delimited format, so you can open it in Microsoft Excel and perform calculations on the data. The information varies according to the test. Here is the information for the
Example of the Tukey test.
Diagnostics information for Tukey test example
threshold
The threshold value: S e,k,f.
qh_critval
Q h S e,k,f
qh
Q h
spp
Root mean square error.
mse
The mean square error.
dof
The degrees of freedom.
ncol
The number of levels.
siglev
The significance level.
cols
The column labels.
diffmean
The difference of the mean value.
q12-critval
Q i,j S e,k,f
q12
Q i,j
stderr
The standard error for mean difference.
lowbnd
The confidence interval lower bound.
uppbnd
The confidence interval upper bound.
mean 1
X i
mean2
X j
See also

