Percentages
Percentages express the count or sum of a numeric variable as a percentage of the base for the column, row, or table. Expressing figures as percentages can make it easier to interpret and compare the data in a table. The following table shows both counts and column percentages.
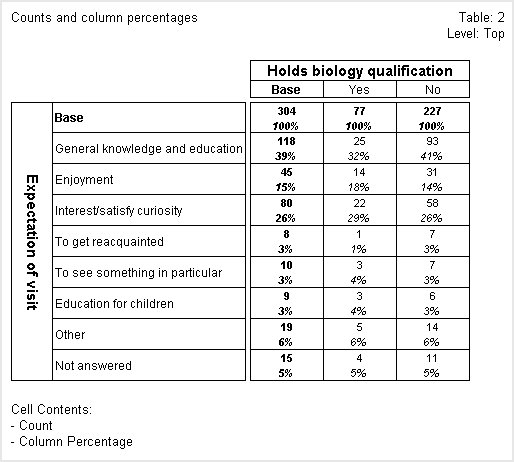
Table showing counts and column percentages
In this table, the first figure in each cell is the count and the second is the column percentage. The count in the Base column of the Base row shows that 304 respondents were asked both of the questions that the variables in the table are based on. These respondents form the sample base for the table.
The counts in the first row after the Base row show that 118 people described their expectation as General knowledge and education, and of these people, 25 hold a biology qualification and 93 do not. The column percentages show that 39% of the respondents in the table describe their expectation as General knowledge and education. A higher percentage of those who do not have a biology qualification (41%) expected to gain general knowledge than those with such a qualification (32%).
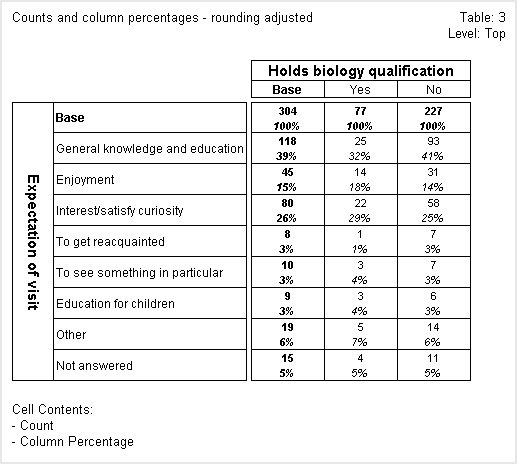
Sometimes, rounding means that the percentages for single response variables do not always add up to 100%. If you add up all of the percentages in the
No column in the above table, you will see that they add up to 101% rather than 100%. This is because UNICOM Intelligence Reporter - Survey TabulationUNICOM Intelligence Reporter performs all calculations using the maximum possible accuracy and only performs rounding immediately before it displays figures in a table. See
Rounding values for more information.
To adjust the rounding so that the percentages add up to 100%, use the
Adjust rounding so that percentages add up to 100% option: see
View Table Options dialog box.
Here is the table after the rounding has been adjusted. Notice that the percentages in the No column now add up to 100%:
Table showing counts and column percentages with rounding adjusted to add up to 100%
Note that the biology and expect variables are both single response variables. In multiple response variables, percentages do not usually add up to 100% and adjusting the figures to do so would not make sense.
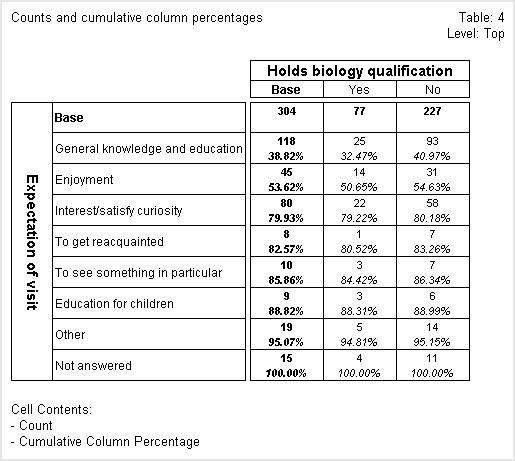
In the next table, the column percentages are shown as cumulative percentages.
Table showing counts and cumulative column percentages
In this table, the column percentages are shown with two decimal places. In all other respects the column percentages in the first row after the Base row are the same as those shown in the column percentages table shown earlier. However, the percentages in the subsequent rows differ. This is because the column percentages for each successive row are added to those of the previous rows to make a cumulative percentage, so the cumulative percentage for the final row is 100%.
The column percentages are not shown in the
Base row. This has been achieved by deselecting
Show 100% in base rows/columns: see
View Table Options dialog box.
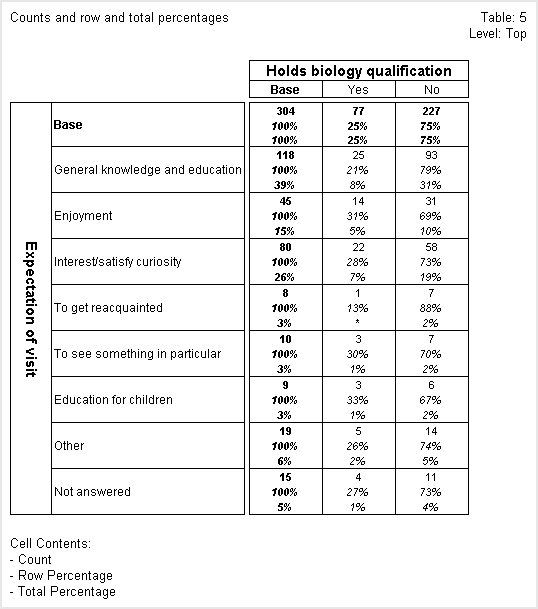
The next table shows counts, and row and total percentages.
Table showing counts and row and total percentages
In this table the first figure in each cell is the count, the second is the row percentage, and the third is the total percentage. Row percentages show what percentage of the respondents in each row fall in each column. For example, if you look at the General knowledge and education row, you can see that 21% of the respondents in the row hold a biology qualification, whereas 79% of them do not.
Similarly, total percentages show what percentage of the total number of respondents in the table fall in each cell of the table. Looking at the General knowledge and education row again, you can see that respondents in the row who hold a biology qualification make up 8% of the respondents in the table and those in the same row without a biology qualification make up 31% of the total for the table.
Note If you have a table that contains only percentage values, you may want to display the table without any percent signs: use the
Display percent signs option (see
View Table Options dialog box).
See also