Structure of tables
Tables can have either one or two dimensions:
▪Side: Defines the rows of the table.
▪Top: Defines the columns of the table.
The body of the table is made up of cells, which contain the basic information conveyed by the table, such as counts, percentages, sums, means, and so on.
You can put a single variable or a combination of variables on the side and top axes. When you put more than one variable on the axis of a table, you can choose whether to concatenate the variables or to nest them.
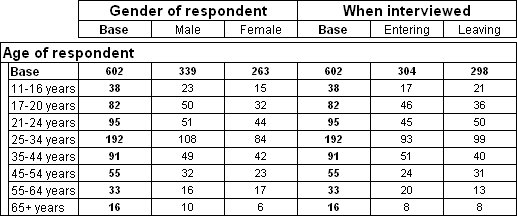
When you concatenate the variables, the variable elements are displayed separately, as if each variable is a separate table in the same display. For example, here is a table in which two variables (gender and interview) are concatenated on the top axis:
Table with two variables concatenated on the top axis
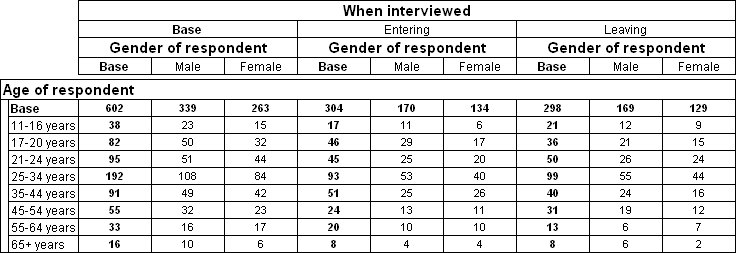
When you nest the variables, the elements of the nested variable are displayed for each element of the variable within which it is nested. The nested variable is called the child variable and the variable within which it is nested is called the parent variable. Here is a table that has the same two variables on the top axis as in the previous table, but this time gender is nested within the interview variable:
Table with two variables nested on the top axis
Whether you choose to concatenate variables or nest them depends on what kind of analysis you want. The first table shows the number of male and female respondents and their age breakdown and the number of people interviewed entering and leaving the museum and their age breakdown. However, it does not show the gender breakdown of the respondents interviewed entering and leaving the museum. For that you need to nest the gender variable within the interview variable (which records whether respondents were interviewed entering or leaving the museum) as shown in the second table.
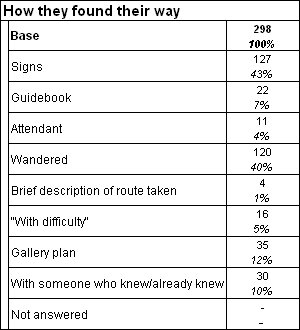
One-dimensional tables are useful for finding out more about individual variables. You can create one-dimensional tables to discover the number and percentage of respondents that are in each category of a categorical variable. For example, the found_way multiple response variable records the coded responses to an open-ended question. By adding this variable to the side axis and defining cell contents of counts and column percentages, you can quickly see the number and percentage of respondents that are in each category. You can easily add other cell contents, such as unweighted counts. If you add cumulative column percentages, the table shows all of the information that is shown in a standard frequency table.
One-dimensional table
You can create one-dimensional tables for numeric variables to show their summary statistics, such as mean, minimum value, maximum value, standard deviation, median, and so on.
See also