Tables
Tables, in this context, are analyses of data. Tables usually combine the data of two or more variables. For example, a table might analyze the age and gender of the respondents in a survey.
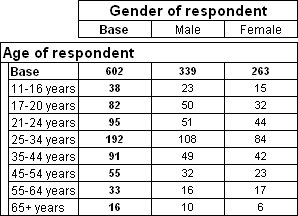
Table of age by gender
In this example, the Base row shows how many respondents there are of each gender and the Base column shows how many respondents there are in each age group. The point where a row and a column intersect is called a cell, and in this table the cells show the number of respondents with the combined set of row and column characteristics. For example, the cell at the intersection of the 25-34 years row and the Male column shows that there are 108 men age between 25 and 34 in the sample.
For instructions on creating a similar table, see
Creating your first table.
See also