Displaying a mean based on factors
This example is based on the Museum sample data set.
rating[{Dinosaurs}].Column{.., mean()}
This creates an axis based on all of the elements in the rating[{Dinosaurs}].Column variable with the addition of a special mean element that shows the mean value of the factors associated with the variable. (Factors are automatically used when you do not specify a numeric variable.)
A factor is a constant numerical value that can be assigned to an element in a categorical variable for use in statistical calculations. Factors are used when you want to base a statistical element on the categories of a categorical variable rather than on a numeric variable. This is because statistics can be calculated on numeric data only and categories are not true numeric values. (Although the Data Model represents the responses to categorical questions as numeric values, these are in fact identifiers or codes and are not suitable for statistical analysis.)
The rating[{Dinosaurs}].Column variable is the Dinosaurs “slice” of a grid question, which asks respondents to rate the various galleries in the museum. Here is the grid question:
Rating grid question
Factors have been assigned to the categories as shown in the following table.
Category | Factor |
|---|
Not at all interested | 1 |
Not particularly interested | 2 |
No opinion | 3 |
Slightly interested | 4 |
Very interested | 5 |
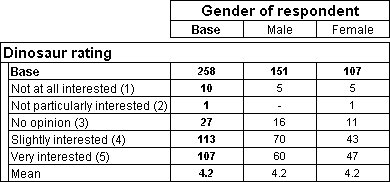
The mean element in this example shows the average factor value for categories chosen by the respondents, and this can give an indication of the general feeling among all of the respondents. In this example, a high mean factor value indicates that on average the respondents gave the Dinosaurs gallery a high rating.
Here is a table that has this axis on the side:
Table showing the mean value of rating factors
Note that when no factors are defined, the mean will be zero. You can set factor values for elements in the axis specification. See
Element properties for more information.
See also


