Banding numeric variables
This example is based on the Museum sample data set.
visits{visits1_5 '1 to 5' expression('visits > 0 And visits _
< 6'),
visits6_10 '6 to 10' expression('visits > 5 And visits < 11'),
visits11_20 '11 to 20' expression('visits > 10 And _
visits < 21'),
visits21ormore 'More than 20' expression('visits > 20'),
mean 'Mean' mean(visits), Stddev 'Standard deviation' _
stddev(visits)}
This example creates an axis based on the visits numeric variable and uses custom expressions to band the responses into categories. It also includes mean and standard deviation special elements based on the numeric variable.
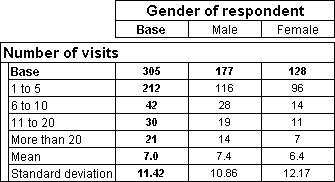
Here is a table that has this axis on the side:
Table showing banded numeric variable
See also