Displaying the sum of a numeric variable
This example is based on the Museum sample data set.
age{.., sumvisits 'Total visits by respondents' sum(visits)}
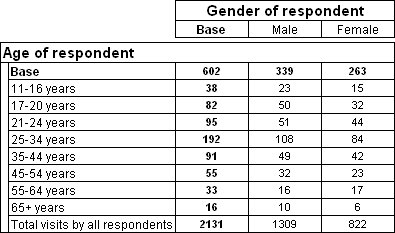
This creates an axis based on all of the elements in the age variable with the addition of a special element that shows the sum of the values in the visits variable. This variable stores the number of previous visits that respondents have made to the museum. Therefore this element shows the total number of previous visits that male and female respondents have made to the museum. A custom label overrides the default.
Here is a table that has this axis on the side:
See also

