Displaying a mode
This example is based on the Museum sample data set.
You can add a row or column on a table to display the most frequently occurring value or mode. In UNICOM Intelligence Reporter - Survey Tabulation, where there is more than one mode value, the lowest is displayed.
visits{base(), mode(visits)}
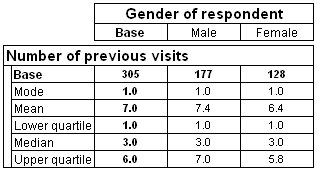
This example displays a mode, together with a mean, median, and two percentiles, for the visits variable.
visits{base(), mean 'Mean' mean(visits), mode 'Mode' mode(visits), percentile25 'Lower quartile' percentile(visits,25), median
'Median' median(visits), percentile75 'Upper quartile' percentile(visits,75)}
Table showing mode and other summary statistics
Here is a table that has this axis on the side:
For information on how to display medians and percentiles as cell items rather than as rows or columns of a table, see
Summary statistics of numeric variables.
See also