Top-level variables tabulated at the top level
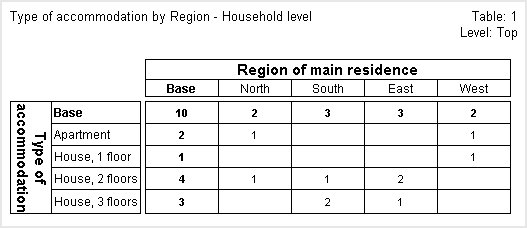
This first table crosstabulates two top-level variables (housetype and region) and is populated at the top level. The counts in the cells refer to households because in this survey the top-level questions refer to households. Notice that the cell in the top left corner of the table shows that there are 10 households in the sample.
See also