When you use the hierarchical view of the data, you need to understand the significance of populating tables at the various hierarchical levels. This example uses the Household sample (see
The Household sample).
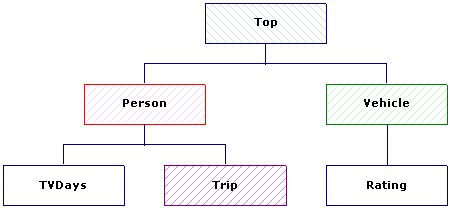
The structure of the levels corresponds to the structure of the loops. This means that because the trip loop is nested within the person loop, the trip level is a child of the person level. The two grids are also represented in the case data as levels, each nested within its parent level. The following diagram shows the levels structure.
When you are using the hierarchical view of the data, you can define the level at which each table is to be populated. The level that you choose affects the figures that are shown in the cells of the table. When you populate a table at the top level, each case corresponds to a household and therefore the counts show numbers of households; when you populate the table at the person level, each case corresponds to a person and therefore the counts show numbers of people; when you populate a table at the trip level, each case is an overseas trip and the counts show numbers of trips, and so on.