Person-level variables tabulated at the person level
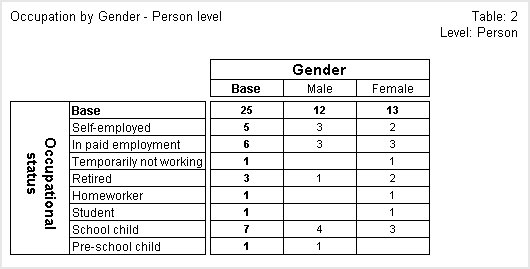
The next table crosstabulates two person-level variables (occupation and gender) and is populated at the person level. Each cell shows the number of people of a given occupation and gender. The top left cell shows that there are 25 cases at the person level, or, to put it another way, there are 25 people in the sample.
See also