Person-level variables tabulated at the top level
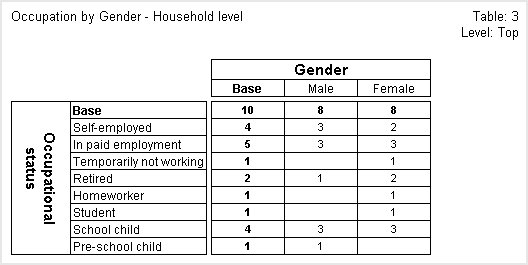
The next table crosstabulates the same two person-level variables, but this time the table is populated at the top level. This means that instead of showing the number of people of a given occupation and gender, each cell now shows the number of households that contain people of the given occupation and gender. The top left cell shows that the base for the table is the same as in the first table shown above. This is what you would expect because both tables are counting the number of households and are unfiltered, and every household contains at least one person.
See also