Tabulating variables from higher levels at a lower level
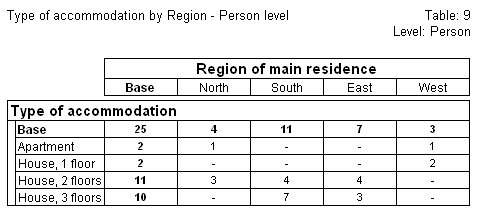
You can also tabulate higher level variables at a lower level, provided that the variables are on the same branch of the structure and are not on parallel branches. The next table crosstabulates two top-level variables (housetype and region) as for table 1, but this time is populated at the person level. The counts in the cells refer to people rather than households. Notice that the cell in the top left corner of the table shows that there are 25 people in the sample.
See also