Showing summary statistics of a numeric variable in the cell contents
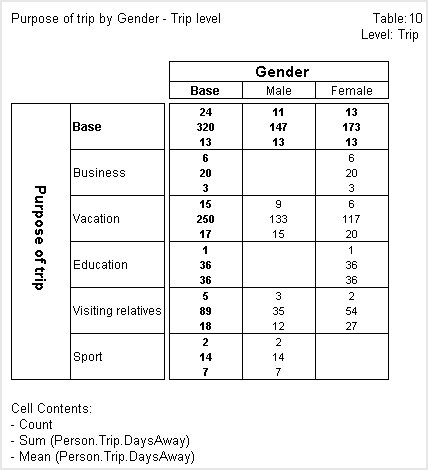
In the next table, the cell contents show not only the counts, but also the sum and mean summary statistics of the DaysAway numeric variable. This is a trip-level variable that stores the length of the trip in days. The sum values show the total number of days away and because the table is populated at the trip level, the mean values show the mean number of days per trip.
Look at the three figures in the top left cell of the table. The first figure is 24, which corresponds with the base in the fourth table shown above, which tabulates two trip-level variables at the trip level. This figure shows the total number of overseas trips that were taken. The next figure is 320, which is the total number of days for all the trips. The final figure is the mean, which shows the average number of days per trip.
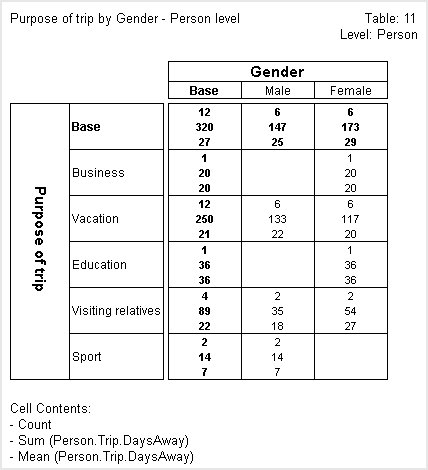
If you now populate the table at the person level, the sum values will stay the same but the mean values will show the average number of days per person instead of per trip. Here is the table populated at the person level.
Look at the three figures in the top left cell of this new table. The first figure is 12, which corresponds with the base in the seventh table shown above, which tabulates the same variables at the person level. This figure shows the total number of people who have taken at least one overseas trip. The next figure is 320, which is the total number of days for all the trips. This figure is the same as when you populated the table at the trip level. However, the mean value is now 27, because it now shows the average number of days away per person instead of per trip.
See also