The base in grid tables
If you look at the grid tables shown in
Understanding grid tables, you will notice that unlike a standard table, there is either a base row or column, but not both. Specifically, the base is shown when the rows or columns are created from the variable inside the grid and not when they are formed from the iterations. The base is calculated in both the rows and columns, but it is not displayed for the iterations, because it can be confusing. To illustrate how the base for the iterations works, this section looks at some tables that show this base. These tables were created using UNICOM Intelligence Reporter, because in UNICOM Intelligence Reporter - Survey Tabulation, you cannot show the base for the iterations.
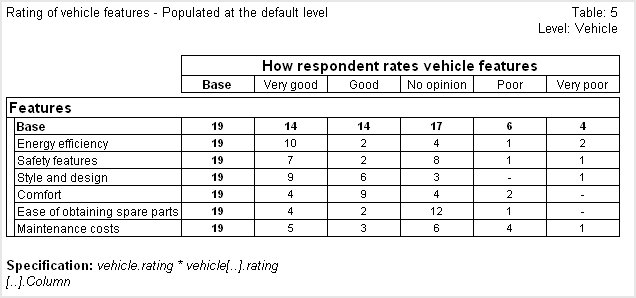
Here is a table that is populated at the default level (the level above the grid, in this case, vehicle), which shows the base on both sides of the table:
Table populated at default (vehicle) level
When this grid table is populated at the vehicle level, each cell shows the number of vehicles for which the given category was chosen in that iteration. In other words, in this table each case is a vehicle. The base therefore shows the total number of vehicles.
Now let's look at the same table populated at the grid level, which in this example is the rating level (the header displays the level as “Features” because this is the description text for the rating grid):
Table populated at grid (rating) level
When the grid table is populated at the level of the grid, each cell shows the number of responses for the given category in that iteration. This means that in this table each response to the rating question in each iteration is a case. The base therefore shows the total number of responses in all of the iterations. However, because each iteration was asked once for each vehicle, the number of cases in all the other cells is the same as in the table that was populated at the vehicle level.
See
See also