Understanding grid tables
This topic provides more detailed information about grid tables and how they work.
(For an introduction to grid tables, see
Grid tables. For instructions for creating an example grid table, see
Creating your first table.)
The first thing to understand is that you can create grid tables from any grid or loop that is defined in the metadata as expanded, regardless of whether the data was actually collected using a grid question in the questionnaire.
To understand how grid tables work, first look at the rating grid question in the Household sample. This grid question is nested in the vehicle loop and so its full name is vehicle[..].rating (which can be shortened to vehicle.rating). This grid question asks respondents to select a rating category for some of the vehicle's features.
Grid questions can be considered categorical loops, which are loops in which a category list defines the iterations and the iterations are presented simultaneously in a grid-like format. The category list that defines the iterations is sometimes referred to as the controlling category list. One or more variables inside the loop define the question(s) that are to be asked for each iteration. The rating grid contains one variable (called Column), which has a category list that defines the rating categories.
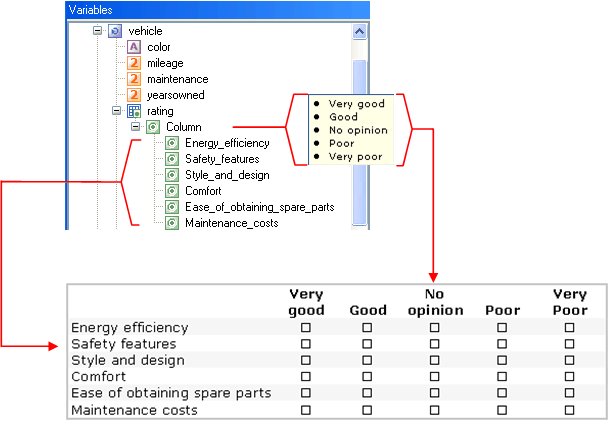
The following diagram shows the grid in the Variable List and how it relates to the grid question when it is presented in a paper questionnaire.
Grid variable in Variable List and in Questionnaire
In this example, each iteration of the grid forms a row of the grid question as it is presented in the paper questionnaire. The columns of the grid question are formed from the categories of the Column variable inside the grid. This variable's full name is vehicle[..].rating[..].Column.
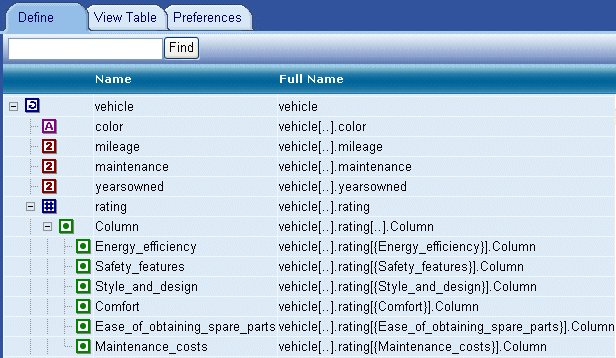
When working with hierarchical variables, it is useful to show the full names in the Variable List. See
The hierarchical variable list for more information.
The Variable List showing full variable names
Now create a grid table for the rating grid, by selecting the grid in the Variable List and clicking Add Grid/Loop in the Table Definition section on the Define tab.
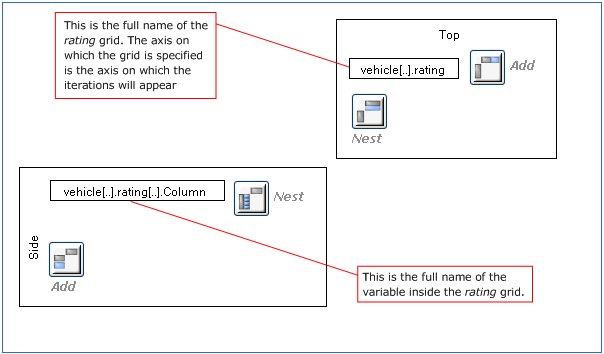
UNICOM Intelligence Reporter - Survey Tabulation automatically updates the side and top axis specification text boxes. Notice that the top axis specification consists of the full name of the rating grid and the side axis specification consists of the full name of the Column variable inside the grid.
Grid table specification showing full names of variables
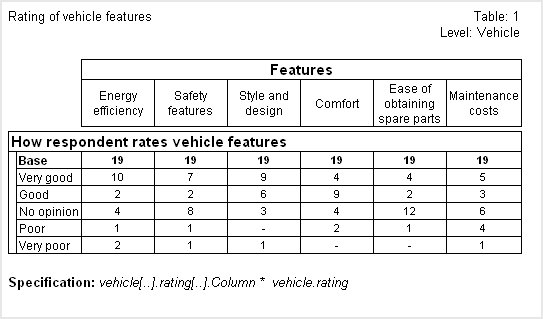
Here is the table:
Table of Rating grid
When you create a grid table by selecting a grid or a loop in the variable list and clicking Add Grid/Loop, UNICOM Intelligence Reporter - Survey Tabulation always orients the grid table according to the default orientation defined for the grid or loop in the metadata. In this grid table, the iterations are displayed as columns because that is how the loop’s default orientation is defined in the metadata.
See
See also


