Comparing UNICOM Intelligence Reporter reports to Cognos Report Studio reports
The following sections provide examples of how reports display in both UNICOM Intelligence Reporter and Cognos Report Studio
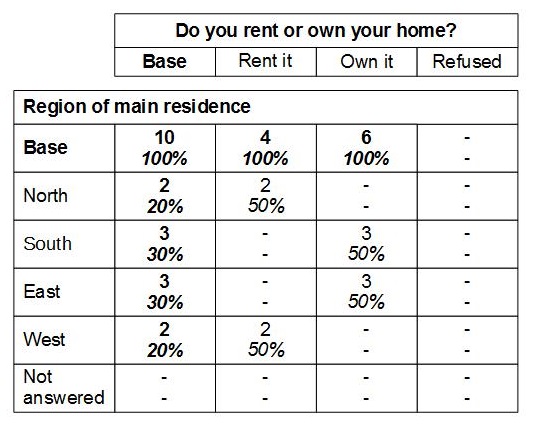
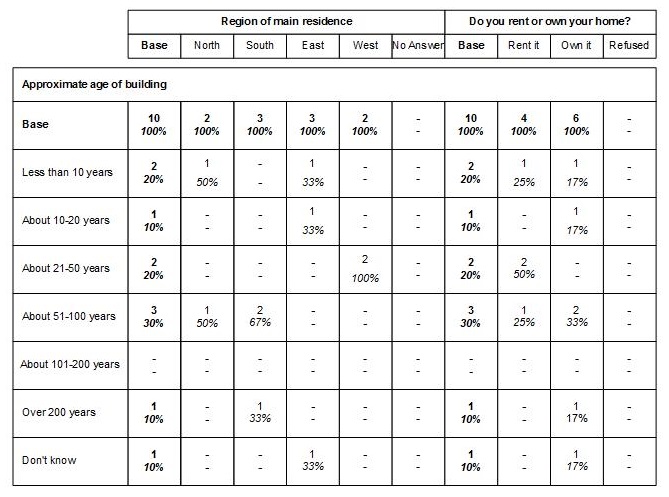
Cell content is Count / Column percentages
The table definition is: Region * Tenure
1 In UNICOM Intelligence Reporter, the report displays as follows:
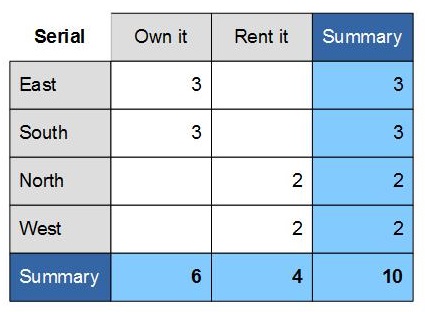
2 In Cognos Report Studio, defining Serial (the default aggregation expression is Count distinct) as Measure results in the following report:
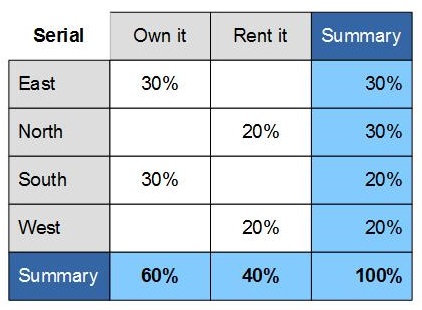
3 In Cognos Report Studio, update the Data Item properties for Serial as follows:
Update Expression to:
percentage(count(distinct([PresentationView].[Dimensions].
[Serial])))
Update Aggregate Function to:
Calculated
The resulting report will resemble the following:
Consuming loop data at different levels
Reports can be rendered at different level. For example:
person[..].tvdays
person;
top
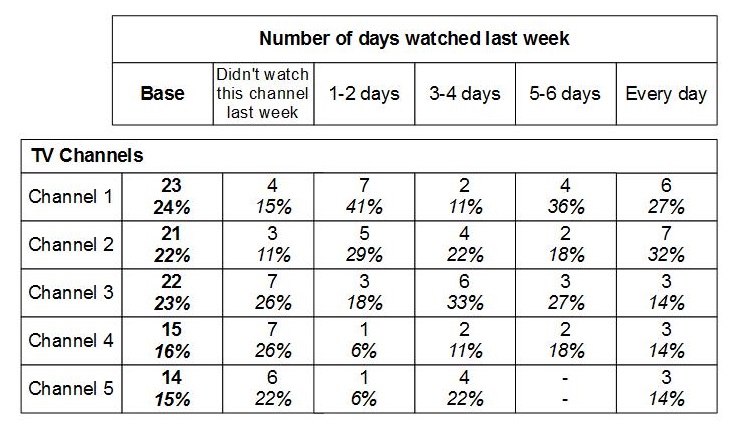
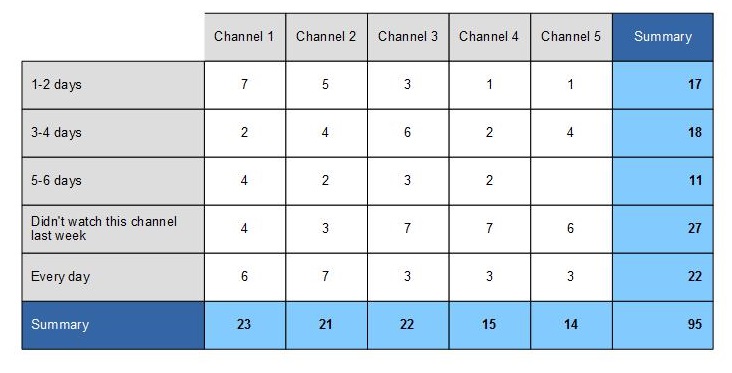
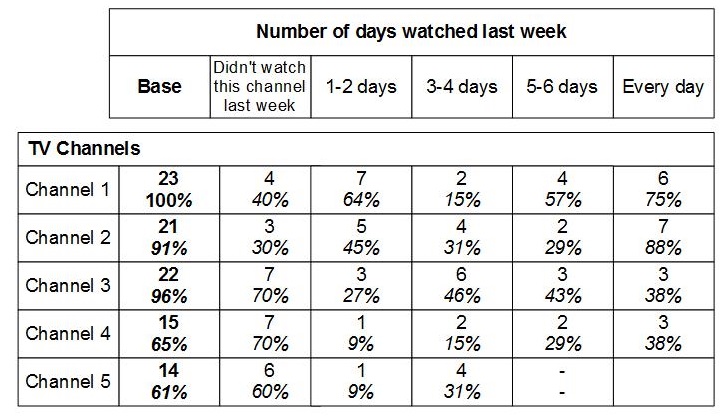
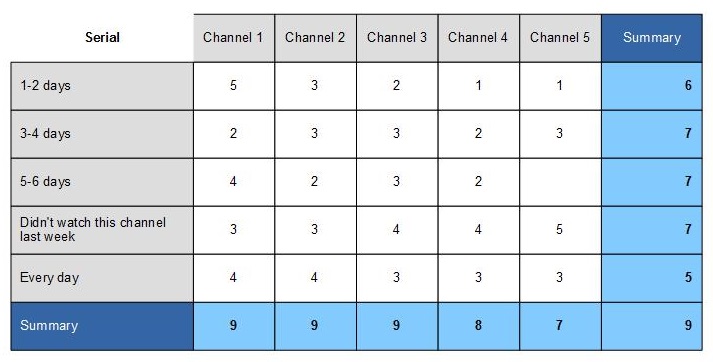
Populating data at different levels for person[..].tvdays in UNICOM Intelligence Reporter results in the following:
In Cognos Report Studio:
Dimensions: LevelID and Column in Person.tvdays.Dimensions
Measure: TvdaysSerial
Populating data at the Person level
When the base count for Person is 23, the resulting UNICOM Intelligence Reporter table is:
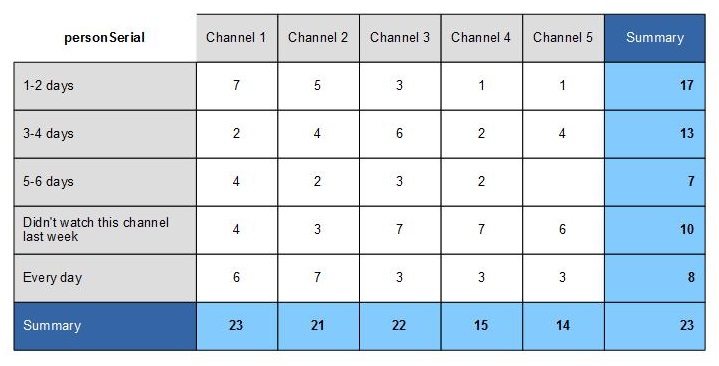
In Cognos Report Studio, the tables displays as:
Dimensions: LevelID and Column in Person.tvdays.Dimensions
Measure: PersonSerial
Populating data at the Top level
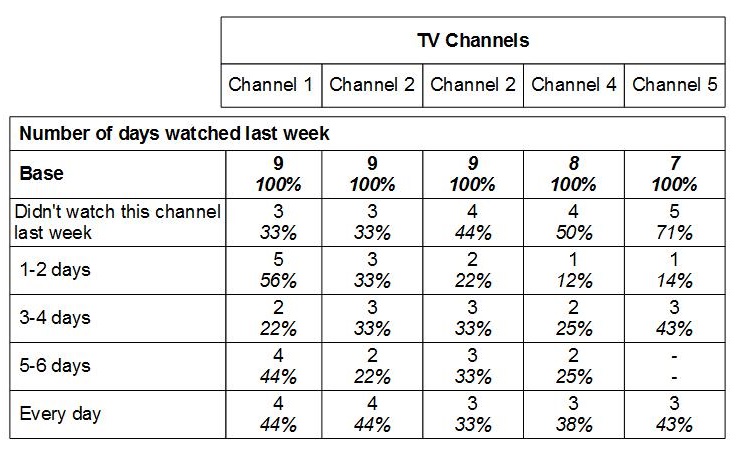
When the base count for Household is 9, the resulting UNICOM Intelligence Reporter table is:
In Cognos Report Studio, the tables displays as:
Dimensions: LevelID and Column in Person.tvdays.Dimensions
Measure: Serial
Concatenation
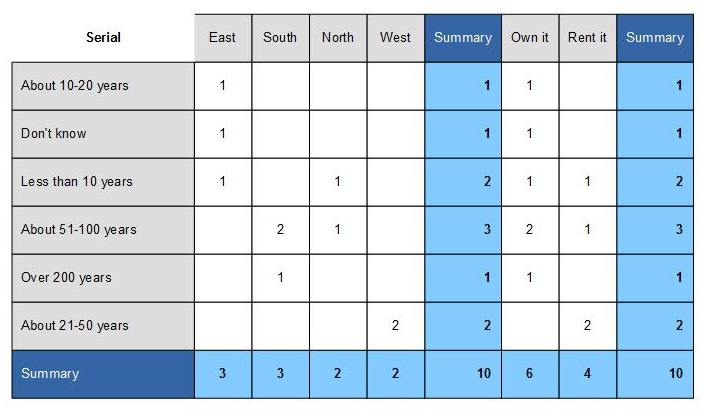
When the table definition is ageofbuilding * region + tenure, the resulting UNICOM Intelligence Reporter report displays as follows:
In Cognos Report Studio, the tables displays as:
See also
Applying percentages on column respondents instead of responses
It is often required to apply a percentage to multiple response questions on the number of respondents in each column rather than on the total number of answers or responses given. The following example follows the same basic steps as outlined in
Building simple reports in Cognos Report Studio.
1 Create a crosstab with the following:
▪Add Age as a top dimension.
▪Add Museums as a side dimension.
▪Add Serial as the measure.
▪Add the filter [museums] is not null.
▪Add an automatic summary for Age and Museums.
▪Add Museums.Index in order to display categories in the questionnaire order.
The resulting table is:
Serial | 11-16 years | 17-20 years | 21-24 years | 25-34 years | 35-44 years | 45-54 years | 55-64 years | 65+ years | Summary |
|---|
National Museum of Science | 27 | 47 | 50 | 107 | 51 | 30 | 16 | 5 | 333 |
Museum of Design | 6 | 14 | 14 | 21 | 15 | 12 | 8 | 2 | 92 |
Institute of Textiles and Fashion | 4 | 7 | 10 | 13 | 5 | 3 | 5 | 1 | 48 |
Archeological Museum | 3 | 5 | 4 | 7 | 4 | 2 | 1 | | 26 |
National Art Gallery | 1 | 5 | 5 | 4 | 2 | 2 | | | 19 |
Northern Gallery | 2 | 2 | 7 | 3 | 2 | 3 | 2 | | 21 |
Other | 1 | 9 | 8 | 9 | 6 | 1 | 2 | 1 | 37 |
Summary | 32 | 60 | 72 | 135 | 59 | 38 | 23 | 8 | 427 |
2 In Query Explorer, add a Data Item from the toolbox, name it pctage, and input the following expression:
[Serial]/[Summary(museums)]
3 Press OK.
You do not want to verify the expression syntax, because it results in a error at this stage.
4 Change the pctage Solve Order property to 100.
5 In Page Explorer, select the table, and then drag pctage from the Data Items pane to the serial column.
6 In Query Explorer, verify that serial is still in the query; if it is not, you must add it.
7 In Query Explorer, change the Solve Order for Summary(Museums) and Summary(Age) to 1. This ensures that the items are calculated before anything else, so that they can be used in the pctage expression. The Data Items panes lists the following items:
▪Age
▪Museums
▪Summary(age)
▪Summary(museums)
▪museums.Index
▪pctage
▪Serial
8 In Page Explorer, change the Data Format property for the four table cells to Percent (using the percentage symbol and no decimal places).
The resulting table is:
Serial | 11-16 years | 17-20 years | 21-24 years | 25-34 years | 35-44 years | 45-54 years | 55-64 years | 65+ years | Summary |
|---|
National Museum of Science | 84% | 78% | 69% | 79% | 86% | 79% | 70% | 62% | 78% |
Museum of Design | 19% | 23% | 19% | 16% | 25% | 32% | 35% | 25% | 22% |
Institute of Textiles and Fashion | 12% | 12% | 14% | 10% | 8% | 8% | 22% | 12% | 11% |
Archeological Museum | 9% | 8% | 6% | 5% | 7% | 5% | 4% | | 6% |
National Art Gallery | 3% | 8% | 7% | 3% | 3% | 5% | | | 4% |
Northern Gallery | 6% | 3% | 10% | 2% | 3% | 8% | 9% | | 5% |
Other | 3% | 15% | 11% | 7% | 10% | 3% | 9% | 12% | 9% |
Summary | 100% | 100% | 100% | 100% | 100% | 100% | 100% | 100% | 100% |
This method of calculating percentages can also be used for single response questions (as an alternative to the previously described expressions).
See also
Creating reports for grid questions
This section discusses various methods for creating reports for grid questions, that are based on Museum data that has been published via UNICOM Intelligence. The section covers many of the standard crosstabs that are commonly used in Market Research (which typically differ than crosstabs that are used in other business intelligence reporting). This section assumes basic Cognos Report Studio knowledge.
To create a grid question report
The following examples demonstrate building and customizing grid question reports that a based on the UNICOM Intelligence Museum sample.
1 In Cognos Report Studio, select the published UNICOM Intelligence Museum package.
2 Create a new report using a crosstab, by either selecting Crosstab on the first screen or from the toolbox.
3 In the Insertable Objects pane, select PresentationView Rating Dimensions.
4 In Page Explorer, add the following Dimensions items:
▪Add Column as a top dimension.
▪Add LevelID as a side dimension.
▪Select Serial as the measure.
5 In Query Explorer, open Rating.Column and create a filter that removes records with null responses:
[Column] is not null
6 Control the sort order by selecting Query1 in Query Explorer.
▪Expand the Codes folder under the Rating folder and drag Column.Index and LevelID.Index into the Query1 item in the Query Explorer pane.
▪Switch to Page Explorer and select Data Sort Edit Layout Sorting. This displays the Sorting dialog.
▪Add Column.Index and LevelID.Index to the Sort list, click the sort button, and then click OK.
Result
The report is rendered as:
Serial | Not at all interested (1) | Not particularly interested (2) | No opinion (3) | Slightly interested (4) | Very interested (5) | NA (Auto Created) |
|---|
Dinosaurs | 10 | 1 | 27 | 113 | 107 | 40 |
Conservation | 3 | 2 | 7 | 30 | 14 | 242 |
Fish and reptiles | 6 | 5 | 28 | 45 | 27 | 187 |
Fossils | 6 | 1 | 15 | 25 | 18 | 233 |
Birds | 9 | 8 | 18 | 32 | 27 | 204 |
Insects | 13 | 2 | 18 | 27 | 19 | 219 |
Whales | 2 | | 14 | 28 | 38 | 216 |
Mammals | 4 | 3 | 26 | 55 | 50 | 160 |
Minerals | 13 | 6 | 14 | 25 | 28 | 212 |
Ecology | 3 | | 5 | 10 | 10 | 270 |
Botany | 11 | 3 | 13 | 14 | 14 | 243 |
Origin of species | 4 | 4 | 16 | 29 | 49 | 196 |
Human biology | 4 | 5 | 17 | 34 | 63 | 175 |
Evolution | 12 | 2 | 18 | 41 | 44 | 181 |
Wildlife in danger | | 1 | 2 | 16 | 13 | 266 |
Other | | | | | | 298 |
To filter the NA (Auto Created) column
In Query Explorer, create a Details Filter with the following expression:
[Column] is not null AND [Column] <> 'NA (Auto Created)'
See also
Presenting measure as a percentage based on the total row values
This section details the process of updating properties for the Serial measure in order to generate percentage values based on the total row values.
1 Update the following Serial measure properties:
Change the Expression value to:
Count([rating].[Dimensions].[Serial]) / total( (count([rating].[Dimensions].[Serial])) For ([LevelID]) )
Change the Aggregate Function value to:
Calculated.
2 Update the Measure display format by left-clicking the data column, selecting Data Format in the Properties panel, and clicking the ellipsis button. This displays the Data Format dialog.
3 Change the Format type to Percent and then change the Percentage Symbol value to %.
Result
The report is rendered as:
Serial | Not at all interested (1) | Not particularly interested (2) | No opinion (3) | Slightly interested (4) | Very interested (5) |
|---|
Dinosaurs | 3.88% | 0.39% | 10.47% | 43.80% | 41.47% |
Conservation | 5.36% | 3.57% | 12.50% | 53.57% | 25.00% |
Fish and reptiles | 5.41% | 4.50% | 25.23% | 40.54% | 24.32% |
Fossils | 9.23% | 1.54% | 23.08% | 38.46% | 27.69% |
Birds | 9.57% | 8.51% | 19.15% | 34.04% | 28.72% |
Insects | 16.46% | 2.53% | 22.78% | 34.18% | 24.05% |
Whales | 2.44% | | 17.07% | 34.15% | 46.34% |
Mammals | 2.90% | 2.17% | 18.84% | 39.86% | 36.23% |
Minerals | 15.12% | 6.98% | 16.28% | 29.07% | 32.56% |
Ecology | 10.71% | | 17.86% | 35.71% | 35.71% |
Botany | 20.00% | 5.45% | 23.64% | 25.45% | 25.45% |
Origin of species | 3.92% | 3.92% | 15.69% | 28.43% | 48.04% |
Human biology | 3.25% | 4.07% | 13.82% | 27.64% | 51.22% |
Evolution | 10.26% | 1.71% | 15.38% | 35.04% | 37.61% |
Wildlife in danger | | 3.12% | 6.25% | 50.00% | 40.62% |
See also
Adding a Mean column
The following example follows the same basic steps as outlined in
Building simple reports in Cognos Report Studio.
2 Select the Tool box tab in the Insertable Objects pane and in the Query Explorer pane, add a new Query Calculation object named FactoredColumn.
3 Enter the following Expression Definition value in the Data Item Expression dialog:
case
when [rating].[Dimensions].[Column]='Not at all interested (1)' then 1
when [rating].[Dimensions].[Column]='Not particularly interested (2)' then 2
when [rating].[Dimensions].[Column]='No opinion (3)' then 3
when [rating].[Dimensions].[Column]='Slightly interested (4)' then 4
when [rating].[Dimensions].[Column]='Very interested (5)' then 5
else null
End
4 In Page Explorer, select the Tool box tab in the Insertable Objects pane and in the Query Explorer pane, add a new Query Calculation object named Mean.
5 Enter the following Expression Definition value in the Data Item Expression dialog:
average([FactoredColumn])
Report specification
Serial | <#Column#> | <Mean> |
|---|
<#LevelID#> | <#1234#> | <#1234#> |
<#LevelID#> | <#1234#> | <#1234#> |
Result
The report is rendered as:
Serial | Not at all interested (1) | Not particularly interested (2) | No opinion (3) | Slightly interested (4) | Very interested (5) | NA (Auto Created) | Mean |
|---|
Dinosaurs | 10 | 1 | 27 | 113 | 107 | 40 | 4.186 |
Conservation | 3 | 2 | 7 | 30 | 14 | 242 | 3.893 |
Fish and reptiles | 6 | 5 | 28 | 45 | 27 | 187 | 3.739 |
Fossils | 6 | 1 | 15 | 25 | 18 | 233 | 3.738 |
Birds | 9 | 8 | 18 | 32 | 27 | 204 | 3.638 |
Insects | 13 | 2 | 18 | 27 | 19 | 219 | 3.468 |
Whales | 2 | | 14 | 28 | 38 | 216 | 4.220 |
Mammals | 4 | 3 | 26 | 55 | 50 | 160 | 4.043 |
Minerals | 13 | 6 | 14 | 25 | 28 | 212 | 3.570 |
Ecology | 3 | | 5 | 10 | 10 | 270 | 3.857 |
Botany | 11 | 3 | 13 | 14 | 14 | 243 | 3.309 |
Origin of species | 4 | 4 | 16 | 29 | 49 | 196 | 4.127 |
Human biology | 4 | 5 | 17 | 34 | 63 | 175 | 4.195 |
Evolution | 12 | 2 | 18 | 41 | 44 | 181 | 3.880 |
Wildlife in danger | | 1 | 2 | 16 | 13 | 266 | 4.281 |
Other | | | | | | 298 | |
See also
Sorting on the Mean column
1 In Page Explorer select LevelID and click the sort button on the button toolbar. You are provided with various sort options.
2 Select the Edit Layout Sorting option. This displays the Sorting dialog.
3 Add Mean to the Sort list, click the sort button, and then click OK.
Result
Running the report displays information that is sorted on the Mean column:
Serial | Not at all interested (1) | Not particularly interested (2) | No opinion (3) | Slightly interested (4) | Very interested (5) | NA (Auto Created) | Mean |
|---|
Other | | | | | | 298 | |
Botany | 11 | 3 | 13 | 14 | 14 | 243 | 3.309 |
Insects | 13 | 2 | 18 | 27 | 19 | 219 | 3.468 |
Minerals | 13 | 6 | 14 | 25 | 28 | 212 | 3.570 |
Birds | 9 | 8 | 18 | 32 | 27 | 204 | 3.638 |
Fossils | 6 | 1 | 15 | 25 | 18 | 233 | 3.738 |
Fish and reptiles | 6 | 5 | 28 | 45 | 27 | 187 | 3.739 |
Ecology | 3 | | 5 | 10 | 10 | 270 | 3.857 |
Evolution | 12 | 2 | 18 | 41 | 44 | 181 | 3.880 |
Conservation | 3 | 2 | 7 | 30 | 14 | 242 | 3.893 |
Mammals | 4 | 3 | 26 | 55 | 50 | 160 | 4.043 |
Origin of species | 4 | 4 | 16 | 29 | 49 | 196 | 4.127 |
Dinosaurs | 10 | 1 | 27 | 113 | 107 | 40 | 4.186 |
Human biology | 4 | 5 | 17 | 34 | 63 | 175 | 4.195 |
Whales | 2 | | 14 | 28 | 38 | 216 | 4.220 |
Wildlife in danger | | 1 | 2 | 16 | 13 | 266 | 4.281 |
See also
Creating reports for loop questions
In market research studies, data is often stored in a hierarchical structure. This, for example, allows a single questionnaire to be used for a household data (the questionnaire stores data for each person in the household). The following example stores household data for each person, each day. Reporting can be conducted at the household level, person level, or in this case the TV day level.
The following report examples are based on Museum data that has been published via UNICOM Intelligence.
See also
Creating a report that is based on the Household level
1 In Cognos Report Studio, select the published UNICOM Intelligence Museum package.
2 Create a new report using a crosstab, by either selecting Crosstab on the first screen or from the toolbox.
3 In the Insertable Objects pane, select PresentationView Rating person tvdays Dimensions.
4 In Page Explorer, add the following Dimensions items:
▪Add LevelID as a top dimension.
▪Add Column as a side dimension.
▪Select Serial as the measure.
5 In Query Explorer, open Column and create a filter that removes records with null responses:
[Column] is not null
6 Control the sort order by selecting Query1 in Query Explorer.
▪Expand the Codes folder under the Rating folder and drag Column.Index and LevelID.Index into the Query1 item in the Query Explorer pane.
▪Switch to Page Explorer and select Data Sort Edit Layout Sorting. This displays the Sorting dialog.
▪Add Column.Index and LevelID.Index to the Sort list, click the sort button, and then click OK.
7 Create summary rows and columns in Page Explorer by selecting <#LevelID#> from the table and adding a summary row via the Data menu: Data Summarize Automatic Summary. Perform the same step for <#Column#>.
Report specification
Serial | <#LevelID#> | Summary |
|---|
<#Column#> | <#1234#> | <#1234#> |
Summary | <#1234#> | <#1234#> |
Result
The report is rendered as:
Serial | Channel 1 | Channel 2 | Channel 3 | Channel 4 | Channel 5 | Summary |
|---|
Didn't watch this channel last week | 3 | 3 | 4 | 4 | 5 | 7 |
1-2 days | 5 | 3 | 2 | 1 | 1 | 6 |
3-4 days | 2 | 3 | 3 | 2 | 3 | 7 |
5-6 days | 4 | 2 | 3 | 2 | | 7 |
Every day | 4 | 4 | 3 | 3 | 3 | 5 |
Summary | 9 | 9 | 9 | 8 | 7 | 9 |
See also
Creating a report that is based on the Person level
Creating a report that is based on the Person level is accomplished by updating the previous Household level report.
1 In Report Explorer, change the measure from Serial to personSerial.
Report specification
personSerial | <#LevelID#> | Summary |
|---|
<#Column#> | <#1234#> | <#1234#> |
Summary | <#1234#> | <#1234#> |
Result
The report is rendered as:
personSerial | Channel 1 | Channel 2 | Channel 3 | Channel 4 | Channel 5 | Summary |
|---|
Didn't watch this channel last week | 4 | 3 | 7 | 7 | 6 | 10 |
1-2 days | 7 | 5 | 3 | 1 | 1 | 11 |
3-4 days | 2 | 4 | 6 | 2 | 4 | 13 |
5-6 days | 4 | 2 | 3 | 2 | | 7 |
Every day | 6 | 7 | 3 | 3 | 3 | 8 |
Summary | 23 | 21 | 22 | 15 | 14 | 23 |
See also
Creating a report that is based on the TVDays level
Creating a report that is based on the TVDays level is accomplished by updating the previous Household level report.
1 In Report Explorer, change the measure from Serial to tvdaysSerial.
Report specification
The report specification is updated as:
tvdaysSerial | <#LevelID#> | Summary |
|---|
<#Column#> | <#1234#> | <#1234#> |
Summary | <#1234#> | <#1234#> |
Result
The report is rendered as:
tvdaysSerial | Channel 1 | Channel 2 | Channel 3 | Channel 4 | Channel 5 | Summary |
|---|
Didn't watch this channel last week | 4 | 3 | 7 | 7 | 6 | 27 |
1-2 days | 7 | 5 | 3 | 1 | 1 | 17 |
3-4 days | 2 | 4 | 6 | 2 | 4 | 18 |
5-6 days | 4 | 2 | 3 | 2 | | 11 |
Every day | 6 | 7 | 3 | 3 | 3 | 22 |
Summary | 23 | 21 | 22 | 15 | 14 | 95 |
See
