Concatenation and nesting
Sample script file: ConcatenatingAndNesting.mrs
This topic shows how to add two variables to the same axis of a table using two different methods: concatenating and nesting. You create two tables using the same three variables. Both tables have the age variable on the side axis. In the first table, interview and gender are concatenated on the top axis; in the second table, gender is nested within interview on the top axis.
These examples assume that you have already created the table Document object and loaded the Museum sample data set as shown in
Creating a simple table of Age by Gender.
Table with concatenated variables
1 Remove the column percentages from the default cell items collection so that the table will show only counts:
TableDoc.Default.CellItems.Remove(1)
2 Create the first table, in which interview and gender are concatenated on the top axis. To concatenate variables on an axis, you use the + operator:
TableDoc.Tables.AddNew("Table1", "age * interview + gender", _
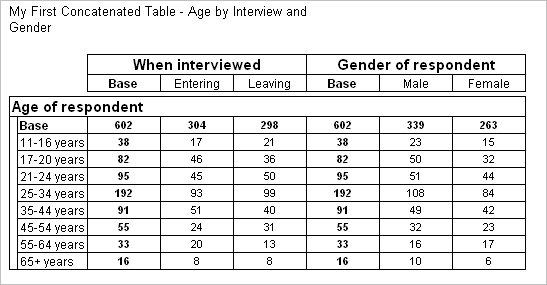
"My First Concatenated Table - Age by Interview and Gender")
Here is the table produced by the script:
When you concatenate variables, the variable elements are displayed separately, as if each variable is a separate table in the same display. The interview variable records whether respondents were interviewed as they were entering or leaving the museum.
The table shows the age breakdown of the male and female respondents and the age breakdown of the respondents who were interviewed entering and leaving. However, it does not show the gender breakdown of the respondents who were interviewed as they were entering nor of those who were interviewed as they were leaving. For that you need to nest gender within interview.
Table with nested variables
When you nest variables, use the > operator:
TableDoc.Tables.AddNew("Table2", "age * interview > gender", _
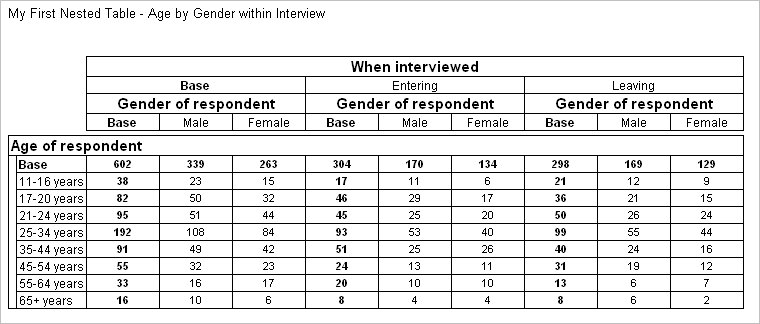
"My First Nested Table - Age by Gender within Interview")
Here is the table produced by the script:
The nested table gives the gender breakdown of the two groups of respondents (those who were interviewed entering and those who were interviewed leaving).
Only the weight or the multiplier in the lowest level is honored when applying weights, for the element of different variables, at different nest levels. Refer to
Element properties for additional information on setting a weight or a multiplier for a variable element.
Requirements
UNICOM Intelligence Reporter
Next
More on concatenation and nesting provides more complex examples of concatenation and nesting, for example, creating tables with more than one level of nesting and combining nesting and concatenation in one table.
See also


