More on concatenation and nesting
Sample script file: MoreOnConcatenatingAndNesting.mrs
Concatenation and nesting explains the difference between concatenating and nesting variables on the table axes. This topic shows how to create tables with more complex nesting and concatenation, and how to use a
With statement to create multiple tables. Here is the script that creates the tables:
With TableDoc.Tables
.AddNew("Table1", "gender > age * before > interview > entrance")
.AddNew("Table2", "gender
+ interview + entrance * education + biology")
.AddNew("Table3", "gender >
interview + entrance * education + biology")
.AddNew("Table4", "gender >
(interview + entrance) * education + biology")
.AddNew("Table5", "(gender + entrance) >
interview * education + biology")
.AddNew("Table6", "education as education1 >
gender + education as education2 > biology")
End With
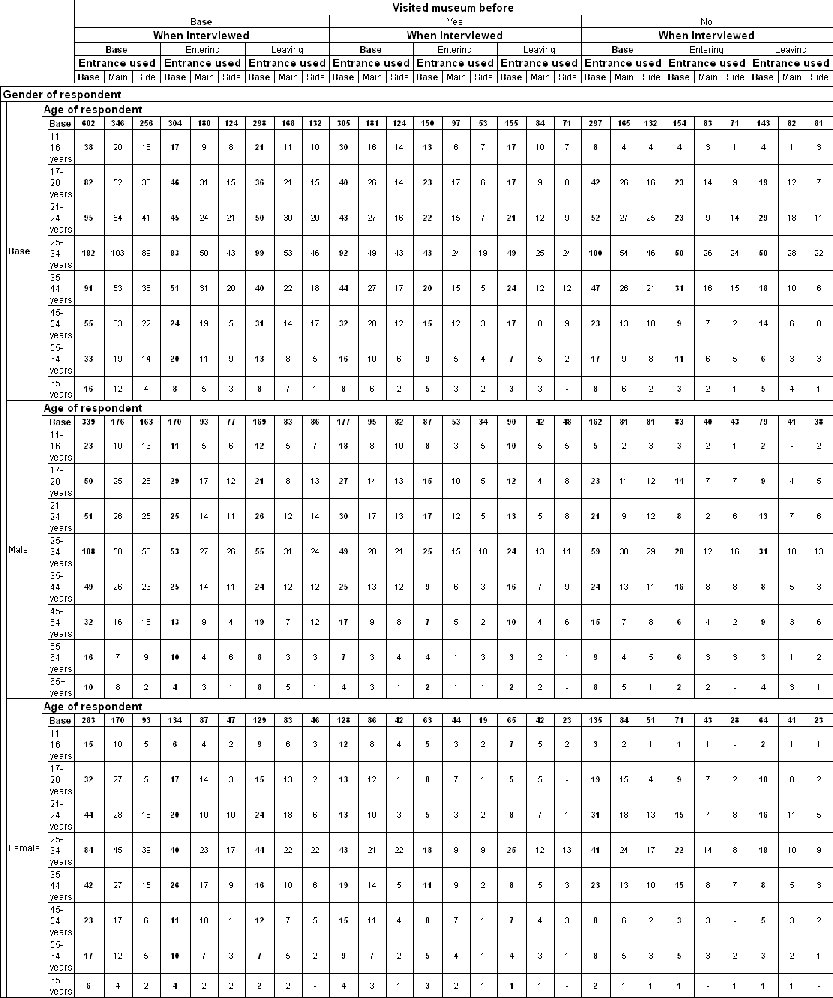
Table 1: Multiple levels of nesting
The first table has one level of nesting on the side axis and two levels of nesting on the top axis. Here is the table produced by the script:
There is no limit to the number of nesting levels that you can specify; however, there is a limit to the number of “sections” that a nested table can contain on the side or top axis: see
Limits. However, each additional level of nesting rapidly increases the number of cells in the table. This increases the time it takes to populate the table and can make the table difficult to use.
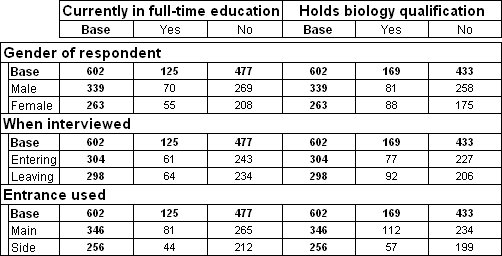
Table 2: Concatenation on side and top axes
Table 2 concatenates three variables on the side and two on the top.
.AddNew("Table2", "gender + interview + entrance * education + biology")
Here is the table produced by the script:
There is no built-in limit to the number of variables you can concatenate on an axis. Generally it is the problems involved in presenting and interpreting very large tables that set the limits.
Table 3: Combining concatenation and nesting
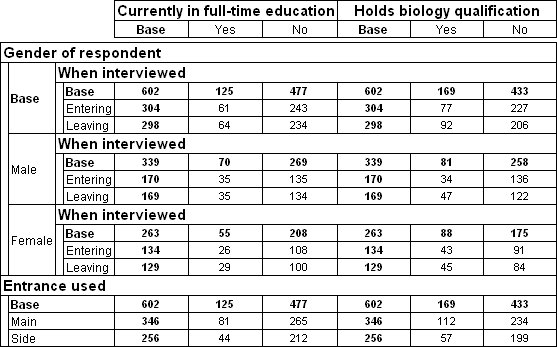
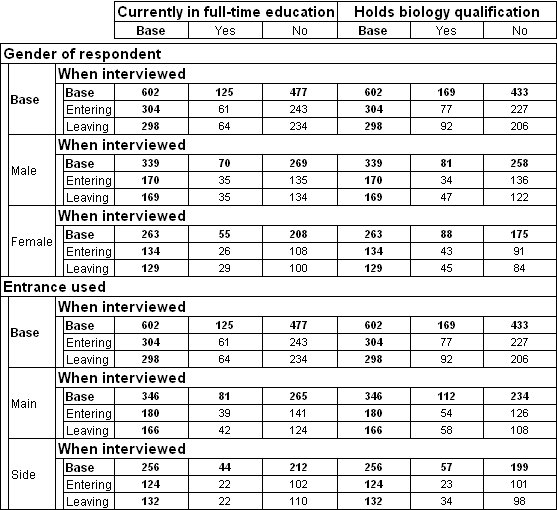
Table 3 combines nesting and concatenation in one axis:
.AddNew("Table3", "gender > interview + entrance * education + biology")
On the side axis of this table, interview is nested within gender, and entrance is concatenated with gender. This type of construction is sometimes referred to as an “unbalanced tree”.
Here is the table produced by the script:
The > operator has a higher precedence than the + operator, but you can override the order of precedence using parentheses.
Table 4: Combination of concatenation and nesting
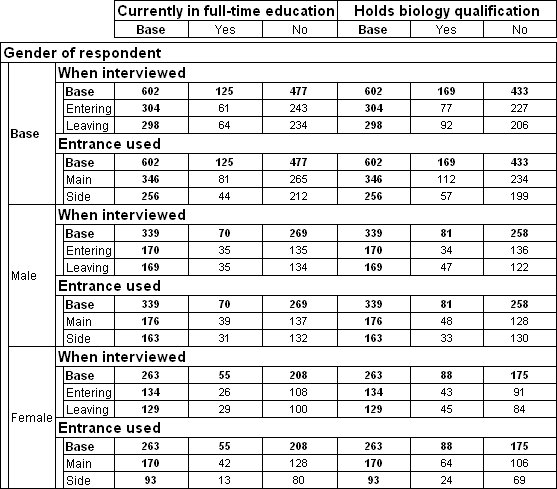
Table 4 uses parentheses to concatenate interview and entrance before nesting them in gender:
.AddNew("Table4", "gender > (interview + entrance) * education + biology")
Here is the table produced by the script:
Table 5: Combination of concatenation and nesting
Table 5 uses parentheses to concatenate gender and entrance before nesting interview within them:
.AddNew("Table5", "(gender + entrance) > interview * education + biology")
Here is the table produced by the script:
In some cases you might want to use same variable twice in a single axis. For example, you might want to nest two variables within a third variable, and display the results in the same table. You can do this in UNICOM Intelligence Reporter 2.3 and later, by using the As keyword:
variable as variable1 > variable as variable2
Table 6: Showing the same variable twice on one axis
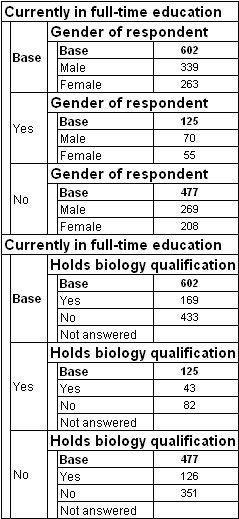
Table 6 uses two education variables, one with gender nested within it and the other with biology nested within it, and concatenates the two education variables.
.AddNew("Table6", "education as education1 > gender + education as education2 > biology")
Here is the table produced by the script:
Requirements
UNICOM Intelligence Reporter
Next
See also
