Creating charts
Sample script file: HTMLCharts.mrs
There are a number of options that are available when you export your tables to HTML. You select the options by changing the export properties. For example, you can export the tables as charts by changing the DisplayOption property to “Chart Only”:
With TableDoc.Exports.mrHtmlExport
.Properties["Interactive"] = True
.Properties["LaunchApplication"] = True
.Properties["DisplayOption"] = "Chart Only"
.Export("HTMLCharts.htm")
End With
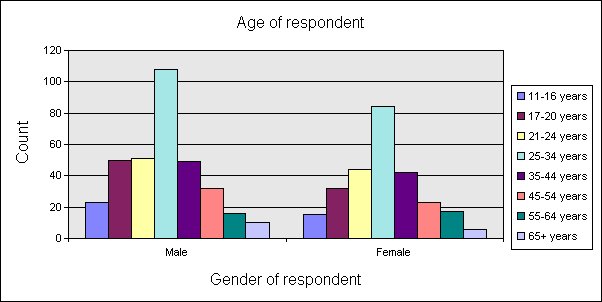
Data from table of age by gender shown in chart form, with rows as series
Here is a table of Age by Gender exported as a chart using this option:
By default, charts are clustered column charts based on column percentages. If a table does not contain column percentages, the chart is based on the counts. For any tables that do not contain either column percentages or counts, the chart is based on the first cell item. Base elements are omitted from the charts. You can create charts for statistical elements, such as elements that show the mean, minimum value, standard deviation, and so on. If more than one such element is included in the table specification, or if the table includes a mixture of categorical and other elements, a separate chart is created for each statistical element in the table.
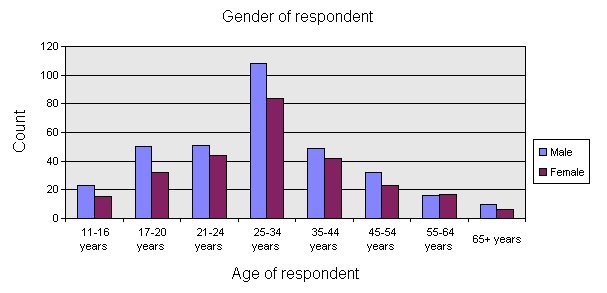
Data from table of age by gender shown in chart form, with columns as series
By default, chart series are based on the table rows. You can base the chart series on table columns by changing the ChartRowsAsSeries property to False:
Microsoft Office Web Components (OWC) is required when using the Microsoft Office Web Components charting engine. This means that to export charts, you need to have Office Web Components (OWC) installed on your computer. However, this is not necessary if you only want to export tables.
Table and chart exported in HTML format
You can also export the table and the chart. The following script exports both the table and the chart, suppresses the logo (which is included by default), uses the black and white style sheet and the frame table of contents layout option:
With TableDoc.Exports.mrHtmlExport
.Properties["Interactive"] = True
.Properties["LaunchApplication"] = True
.Properties["DisplayLogo"] = False
.Properties["DisplayOption"] = "Table and Chart"
.Properties["LayoutStyle"] = "Frame Table of Contents"
.Properties["PresentationStyle"] = "Black and White"
.Export("HTMLTablesAndCharts.htm")
End With
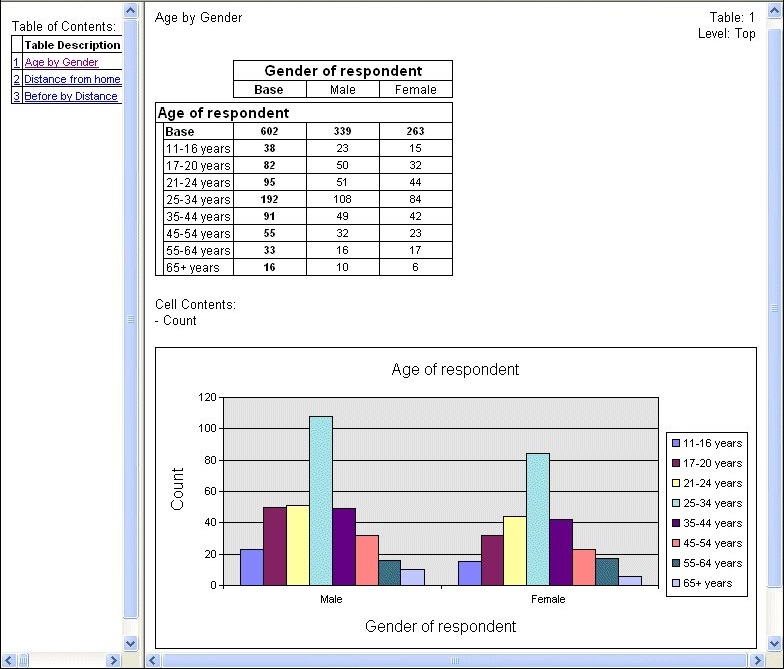
Here is the table and chart:
For more information about customizing the HTML export, see
HTML tables export.
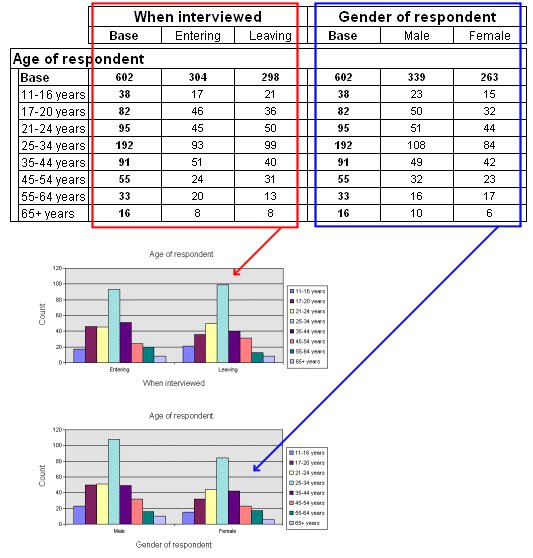
Concatenated table and the same data shown in the form of two charts
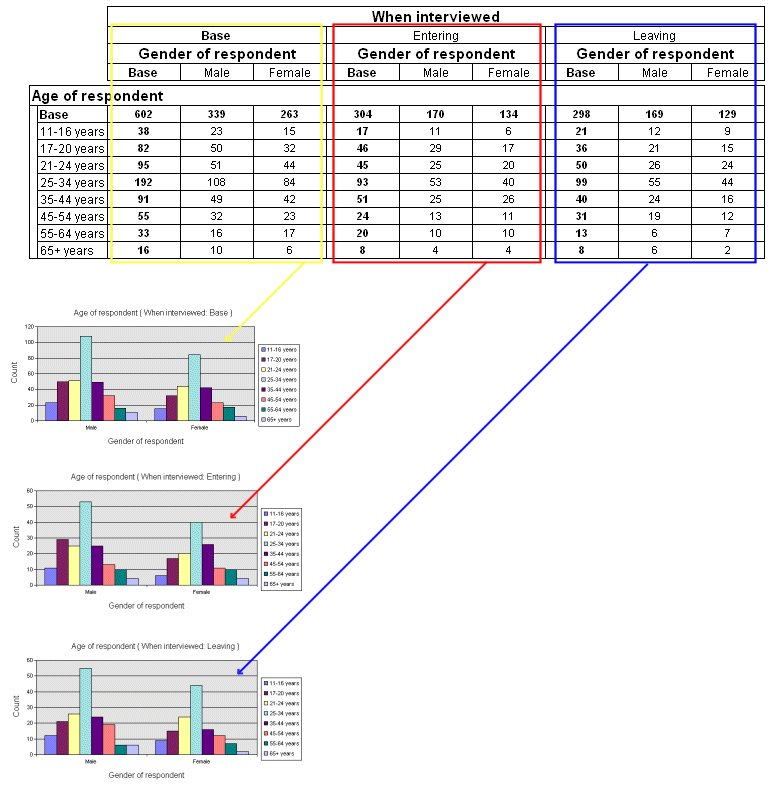
For concatenated and nested tables, a separate chart is created for each section of the table. For example, the following diagrams show the charts that are created for the concatenated and nested tables created in
Concatenation and nesting.
Here is the concatenated table:
Nested table and the same data shown in the form of three charts
Here is the nested table:
When you export charts to Excel, PowerPoint, or Word, you can optionally export the charts to a user-defined custom chart type that you have set up using Excel. For more information, see
Exporting charts using Microsoft Excel custom chart types.
Requirements
UNICOM Intelligence Reporter
Microsoft Office
Next
See also
