Summary statistics of numeric variables
The following table shows additional notation used in the remainder of this topic except where stated otherwise.
|
Notation
|
Description
|
|
Value of the variable for case i
|
|
Weight for case i
|
|
Number of cases
|
|
Sum of the weights for the first i cases
|
|
Mean for the first i cases
|
Calculating the cell contents that are dependent on a numeric variable
The following table provides the formulas used by UNICOM Intelligence Reporter to calculate the cell contents that are dependent on a numeric variable, with the exception of percentiles: see
Percentile.
|
Item
|
Formula
|
|
Mean
|
|
|
Sum
|
|
|
Minimum
|
|
|
Maximum
|
|
|
Range
|
|
|
Mode
|
Value of X j that has the largest observed frequency. If there are several modes, the first one encountered in the data is selected.
|
|
Median
|
The median is the 50th percentile. See Percentile. |
|
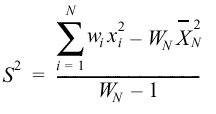
Variance
|
|
|
Standard Deviation
|
|
|
Standard Error
|
|
Percentile
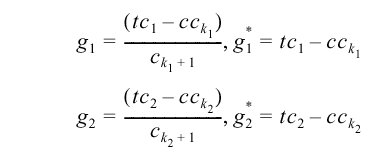
UNICOM Intelligence Reporter uses one method for computation of percentiles. Let
where p is the requested percentile divided by 100, and k 1 and k 2 satisfy
Then
Let x be the pth percentile; the definition is as follows:
Notes
Quantum uses the Aempirical (Empirical Distribution Function with Averaging) formula to calculate median. The expression is:
See also


