Nesting variables
This topic shows you how to nest variables on the axes of a table. It shows how to create a table using the same three variables (
age,
interview, and
gender) that you used in
Concatenating variables, but this time you nest
gender within
interview on the top axis.
When you nest the variables on an axis, the elements of the nested variable are displayed for each element of the variable within which it is nested. The nested variable is called the child variable and the variable within which it is nested is called the parent variable.
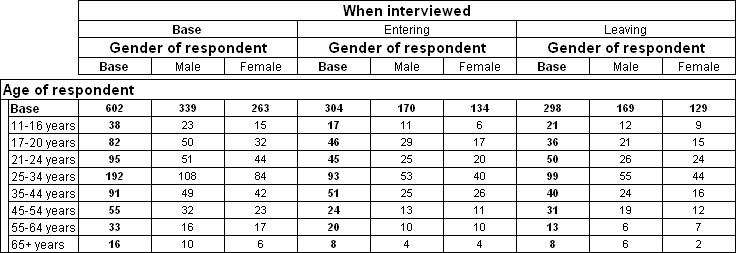
Table with two variables nested on the top axis
This table gives the gender breakdown of the two groups of respondents (those who were interviewed entering and those who were interviewed leaving).
1 Start a new table and switch to the Define tab.
2 On the Table List toolbar, click the Create table icon

.
This adds a new table to the Table List, selects it, and if necessary, switches to the Define tab.
Now define the table in the Table Definition section.
3 In the Variable List, select the age variable.
4 Click Click to add in the Side axis, or drag the icon that is next to the age variable onto Click to add in the Side axis.
5 In the Variable List, select the interview variable.
6 Click Click to add in the Top axis, or drag the icon that it next to the interview variable onto Click to add in the Top axis.
7 In the Variable List, select the gender variable.
8 Click Nest in the Top axis or drag the icon next to the gender variable and drop it on Nest in the Top axis.
9 You have now completed defining the structure of the table. To see the finished table, click the
Populate icon

.
You can use the same techniques to nest additional variables on either axis. Each additional level of nesting rapidly increases the number of cells in the table and this can make the table hard to present, understand, and interpret. UNICOM Intelligence Reporter - Survey Tabulation has a built-in limit to the maximum possible complexity of nested tables, but the practical difficulties of presenting and interpreting very complex nested tables generally impose a limit long before the built-in limit is reached.
10 Switch back to the Define tab and click the Advanced View button in the Table Definition section.
The specification for the Top axis is "(interview) > (gender)".
> (greater than sign) indicates that the variable on the right is to be nested within the variable on the left.
Creating your first table shows that an alternative way of creating a table is to drag the variable icons into the Side and Top boxes. If you drop a variable on top of an existing variable in either of these boxes, UNICOM Intelligence Reporter - Survey Tabulation inserts
>, indicating that the new variable is to be nested within the existing variable.
See also


 .
.