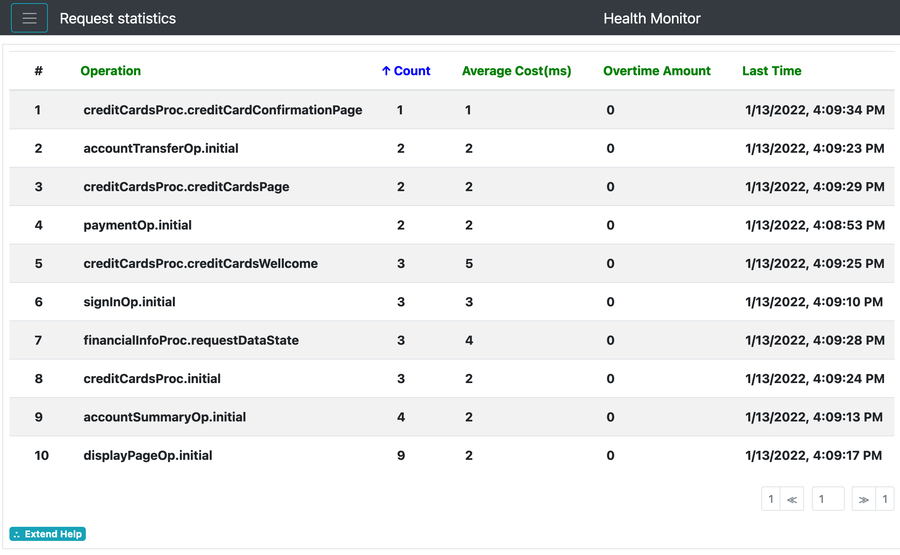
Request statistics
Launch from Menu Button -> Activities -> Request statistics
This page list the statistics information for each operation (all of its requests).
You can sort the list by clicking the column’s title.
▪ Count
The amount times the operation ever been executed.
▪ Average Cost(ms)
The average(weighted) cost to execute this operation.
▪ Overtime Amount
The amount times that the operation need more time than the throttle (
monitor_throttle) set in
btt.xml on execution.
▪ Last Time
The last execution time of the operation
You can enable or disable this function on demand
– at runtime at Overview page as described in
Overview You can set the throttle to monitor the slow operation at
btt.xml as described in
DeploymentGo up to

