Formulae
The formulae for the statistical tests in this section use the following conventions:
▪In the formulae for axis-level test statistics, the formula is applied separately to the counts in each column or row, according to whether the axis containing the stat= option is the row or column axis:
k | The number of basic count elements in the axis or segment. |
ni | The (weighted) count in the ith cell of a row or column representing that axis. |
N | The (weighted) base of that row or column. |
U | The unweighted base of that row or column. |
▪In formulae for table-level test statistics:
r | The number of basic count rows from which the statistic is calculated. |
c | The number of basic count columns from which the statistic is calculated. |
nij | The (weighted) count in row i, column j. |
N, Ni, Nj | The (weighted) bases of the table overall, column i and row j respectively. |
▪A dot suffix indicates summation over the replaced index; so, for example, the formula for a column total is:
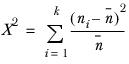
One-dimensional chi-squared test
If there are k elements in the axis, then:
is tested against the χ2 distribution with ( k - 1 ) degrees of freedom.
where:
is the expected number in each cell.
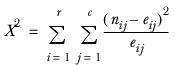
Two-dimensional chi-squared test
is tested against the χ2 distribution with ( r – 1 ) ( c – 1 ) degrees of freedom.
where:
is the expected number in each cell.
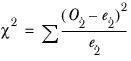
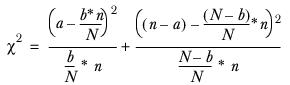
Single classification chi-squared test
Where:
O | The observed value of the subsample. |
e | The expected value of the subsample. |
a | The number of respondents in the cell being tested (that is, the subsample). |
b | The (weighted) number of respondents in the element. |
n | The number of respondents giving a particular answer (that is, the sample). |
N | The (weighted) total number of respondents in the table. |
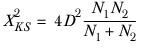
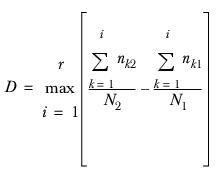
Kolmogorov-Smirnov test
is tested against the c2 distribution with 2 degrees of freedom.
where:
is the maximum difference found between the two cumulative distributions.
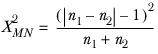
McNemar’s test
is tested against the c2 distribution with 1 degree of freedom.
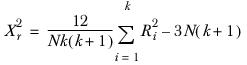
Friedman’s test
where Ri is the sum-of-ranks in cell i of the axis, is tested against the χ2 distribution with k - 1 degrees of freedom.
See also