Rim weighting
If the run is weighted using rim weighting, the file also contains a set of tables showing, for each element of each dimension in the matrix:
▪The input frequency and input percent — these are the number and percentage of respondents that belong in the element.
▪The projected frequency and projected percent — these are the number and percentage of respondents required in the element. The frequencies are the values read from the weighting matrix.
▪The rim weights — an asterisked figure indicates that the weight is outside the acceptable range for rim weights.
▪The output frequency and output percent — these are the figures in each element after the weights were applied.
The following details are also shown:
▪The root mean square (rms)
Rim weighting calculates the weights for each cell in the weight matrix using a form of regression analysis. The aim is to distort each variable as little as possible while trying to attain all the desired proportions among the characteristics. The formula is given for a rim weighting matrix with two dimensions, but the same principle applies when there are more dimensions.
Using the following notation, where a dot in the suffix indicates summation over the replaced index:
mi· | The target number in element i in the first dimension. |
ni· | The sum of the observed numbers in element i in the first dimension. |
m·j | The target number in element j in the second dimension. |
n·j | The sum of the observed numbers in element j in the second dimension. |
I | The number of elements in the first dimension. |
J | The number of elements in the second dimension. |
The formula for the weight adjustment is
where
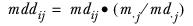
mdij | The weight adjustment calculated in the previous iteration for the cell at the intersection of element i in the first dimension and element j in the second dimension. In the first iteration, it is substituted with the following formula: |
md·j | The sum of the weight adjustments calculated in the previous iteration for element j in the second dimension. In the first iteration, the expression  is substituted with 1. |
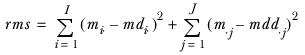
The calculation for the root mean square is
where
mdi· | represents the sum of the weight adjustments calculated in the previous iteration for element i in the first dimension: |
mdd·j | represents the sum of the weight adjustments calculated in the current iteration for element j in the second dimension. |
At the end of each iteration, Quantum compares the root mean square with the product of the total target sample size and the given limit. (The limit defaults to 0.005, but it can be set to another proportion in the rim weighting parameters file.) The iterations continue until all the weights are within the limit or the maximum number of iterations has been reached.
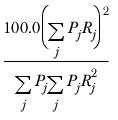
▪The rim weighting efficiency — this figure gives an indication of how well balanced the sample is. The calculation is as follows.
If Pj is the preweight for person j, and Rj is the rim weight for person j, the rim weighting efficiency is:
If the data for many respondents needs to be weighted heavily up or down, the efficiency percentage is low. The greater the percentage, the more well balanced the sample.
▪The maximum respondent rim weight.
▪The minimum respondent rim weight.
Normally Quantum reports the rim weights as they are at the final iteration. If requested to do so, Quantum will report the rim weights it calculates at every iteration separately.
The name of the weighting report file is weightrp on all systems.
See also