solidDB Help : Configuring and administering : Monitoring solidDB : Using Dashboard : Exploring Dashboard
  
Exploring Dashboard
The PMON tab consists of a navigation menu and a display pane. Click an entry in the navigation menu to display a view that contains a set of graphs.
The following table details the default views that are available, and the contents that they contain.
 
Navigation menu entry
Description
OVERVIEW
Graphs that display the number of executed SQL commands, current database size, and memory size.
IN MEM TABLES
Graphs that display statistics for the in-memory database.
WORKLOAD
Graphs that display the number of different SQL commands that ran on the server.
FILE ACCESS
Graphs that display statistics on I/O usage.
BONSAI
Graphs that display the state of the Bonsai tree.
OPERATIVE
Graphs that display the current thread and checkpoint count as well as the HotStandby state.
CACHE
Graphs that display statistics for cache reads, writes, and finds.
Navigating graphs
Use the following mechanisms to navigate the graphs:
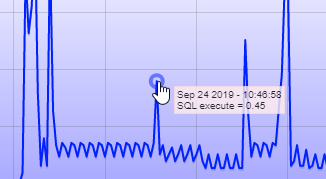
Hover the mouse over a point in a graph to display a tooltip that gives details of the value of the pmon at that particular time.
Screenshot that shows the tooltip
Zoom into a graph by using the mouse to select an area of the graph. The selected area expands to fill the space allocated to the graph. Double-click on the graph to return to the default display.
Scroll a graph by holding the Alt key and dragging the graph with the mouse.
Go up to
Using Dashboard