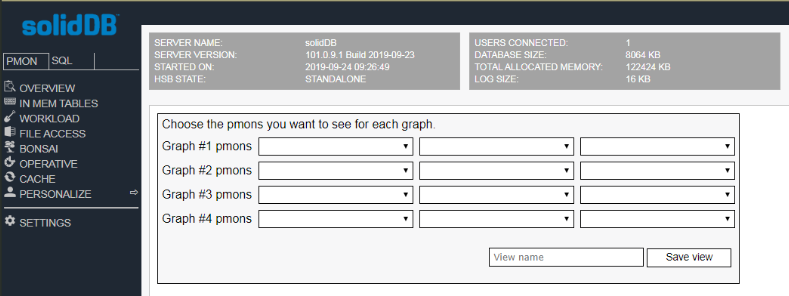
Adding and modifying views in Dashboard
You can customize the views that are displayed in the Dashboard interface.
To add your own set of graphs to a view:
1 Click PERSONALIZE in the navigation menu.
A dialog is displayed where you can define up to four graphs that each display up to three pmons.
2 Select the pmons to include in each graph.
3 Type a name for the view, and click Save view.
The view name is added to the navigation menu.
To modify an existing view:
1 Click the view name in the navigation menu.
2 Add a graph by clicking the blank graph, and selecting the pmons you want to include in the graph.
You can also change the name of the view that displays the graph.
3 Remove a graph from the view by clicking the
Remove icon

, and then
OK to confirm.
Note When you remove the last graph from a view, you remove the whole view.
4 Modify a graph by clicking the
Edit icon

and changing the pmons that are displayed in the graph.
You can also change the name of the view that displays the graph.
To remove a view:
Remove all the graphs from the view and the view is then removed from the navigation menu.
Go up to


 , and then OK to confirm.
 and changing the pmons that are displayed in the graph.