The System Architect Metamodel diagram enables you to get an automatic rendering of the underlying metamodel of the repository, or any part of it. This can help you to understand how all of the information types that you are filling out in the repository are interrelated.
To create a metamodel diagram
1 Select File > New Diagram. Specify the diagram type as Meta Model and give it a name.
Note The Metamodel diagram is available at all times in System Architect, you do not need to turn it on in the Property Configuration dialog.
2 With the Metamodel diagram open, select Draw, Create Meta Model.
3 The Meta Model selection dialog appears. Select from the following options:
Create metamodel by diagram type
Generate a metamodel of a diagram type, all symbol types that can be drawn on it, and all definitions for those symbols.
Create metamodel by Explorer tab
Generate a metamodel of all artifact types that can be created in a tab of the Explorer (such as the UML tab, Data Modeling tab, Business Modeling tab, and so on).
Depth of references depicted
Control the level of references included in the metamodel. The higher the level, the more complex the diagram will be.
Meta-model arrangement
Specify how the metamodel is presented. You may choose from a Network structure, Hierarchies Arranged Horizontally, or Hierarchies Arranged Vertically.
4 Make your selections, and then click OK to create the metamodel.
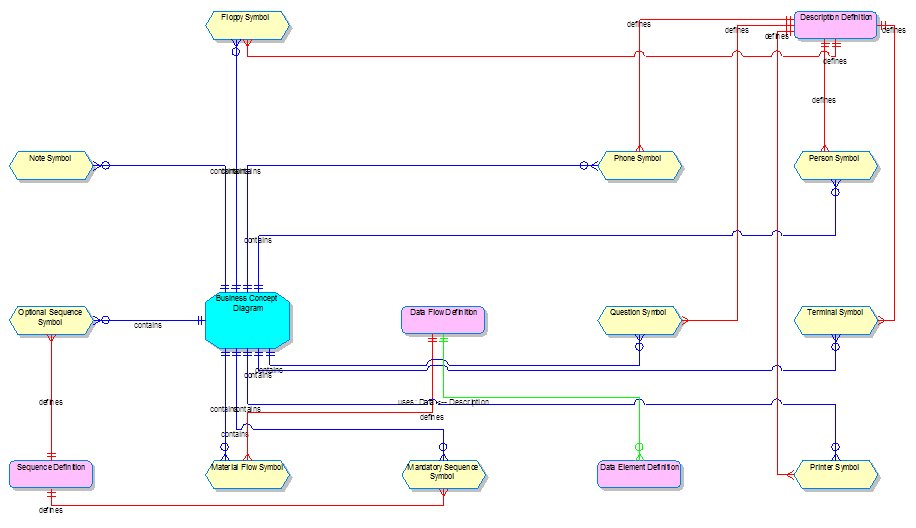
The example below was created by selecting the diagram type as Business Concept, Depth of 1 and Meta-model arrangement as Network. The blue symbol represents the Business Concept Diagram type; the yellow symbols represent the symbol types that can be drawn on that diagram type, and the pink symbols represent the definitions that define those symbol types. If you chose a depth of 2, you would get all definition types related to the initial definition types drawn. A depth of 3 would get definition types related to those definition types, and so forth.
Lines produced are color-coded by their categorization: Contains:blue, Defines:red, Identifies(keys):pink, other:green. A line is produced for each unique set of the following data: from object, to object, categorization, target cardinality. The details of the relationship are stored in the Graphic Comment: name of relationship / a list of these entries: name of relationship: property label <-- property name. For relationships based on properties, the from cardinality is always ‘One and Only One’ denoted by || and this identifies the direction in which the relationship can be navigated. Contains relationships are similarly navigated from the diagram to the symbol. Defines relationships are navigated from the symbol to the definition.