Cluster tuning example
This topic provides an example of how to tune a cluster to improve performance. You can follow a similar procedure for your own system.
Scenario, requirements, and objective
The test is based on 5000 concurrent interviews. Projects must be realistically sized and use a wide range of interviewing features. The objective is to optimize and soak test the cluster, aiming for an average response time of four seconds and a maximum response time of eight seconds.
Test projects
Projects in the tests were set up as follows:
|
|
Small projects
|
Medium projects
|
Large projects
|
|
Number of variable instances
|
300
|
1500
|
4500
|
|
Number of categories (approximate)
|
1000
|
2000
|
3000
|
|
Number of questions asked
|
30
|
150
|
150
|
|
Number of expression routings
|
10
|
50
|
50
|
|
Grid styles
|
For all grids
|
For all grids
|
For all grids
|
|
Custom validation
|
1 text variable
|
5 text variables
|
5 text variables
|
|
Total templates
|
|
|
|
|
Total images
|
20
|
20
|
20
|
|
Total pages asked
|
5
|
25
|
25
|
These test projects are installed as part of the UNICOM Intelligence Developer Documentation Library in:
[INSTALL_FOLDER]\IBM\SPSS\DataCollection\<version>\DDL\Scripts\Interview\Performance
The test
500 projects were activated, all with sample management and quota control. The addrandom script was used for sample management and 22 quota cells were used for quota-ing.
Interviews ran on 100 of the activated projects, using varying mixes of small, medium, and large projects. On each interview, sleep times for each page were based on the size of the page.
Results of the test
The test successfully ran 5000 concurrent interviews, completing more than 180000 interviews in a 12-hour period. Memory was stable across all 28 engines with less than 500Mb used per engine. Queued requests never remained above 100. The average page time was less than two seconds, and the average number of pages per second was approximately 200.
Hardware configuration after cluster tuning
Three Web Servers
▪3 dual 3.0GHz Xeon with 1Gb RAM
Four UNICOM Intelligence Interviewer instances
▪3 dual 3.0GHz Xeon with 8Gb RAM
▪1 dual 2.8GHz Xeon with 4Gb RAM
The guideline of one engine per 1Gb was followed, hence 28 engines. Ideally the UNICOM Intelligence Interviewer s would have been identical.
One Database Server
▪1 dual 2.8GHz Xeon with 4Gb RAM
▪6 x 10K SCSI disks in RAID 5
Note This specification is the hardware that was used for the purposes of this example. It is not a recommendation of the hardware to use with UNICOM Intelligence Interviewer.
How the cluster was tuned
The Web tier queues incoming requests, and uses a pool of threads to service the requests in the order in which they appear in the queue. The thread pool quickly frees the Web server thread to handle another incoming request and ensures that the application scales as more clients make requests of the server. It is therefore the key to the high performance and scalability of the Web tier. By default, each instance of the Web tier is configured to use a thread pool of eight threads for each CPU. For example, the mrIWeb thread pool for a quad-CPU server will use 32 threads.
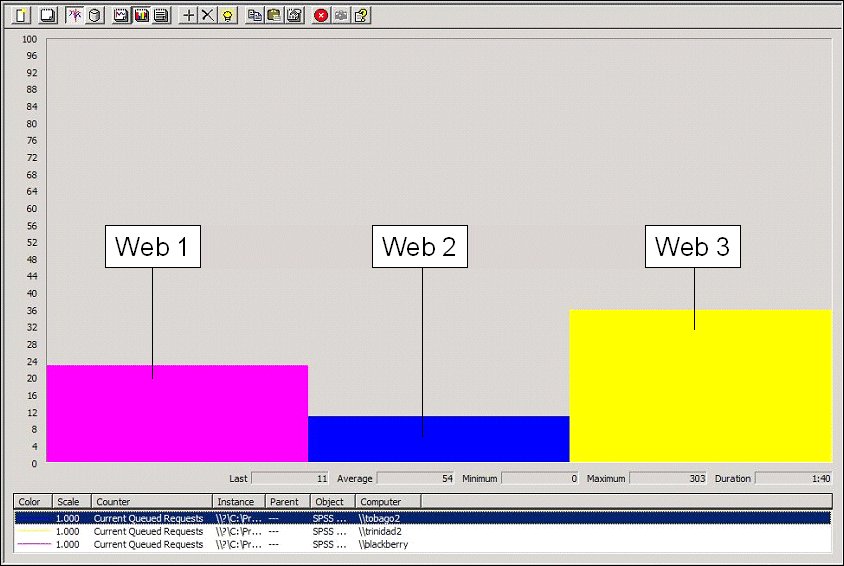
You can monitor the thread pool using the Current Queued Requests performance counter on the Web tier. This performance counter reports how many requests are waiting for a thread to become free in the thread pool . In a loaded cluster you should expect to see some queued requests; however, a sustained reading of greater than 100 indicates poor response times to the respondent and is the best indicator that a cluster is overloaded. Monitoring this counter was the primary means of tuning the example cluster.
Monitoring Current Queued Requests for a heavily loaded cluster
The following illustration shows a heavily loaded cluster that is still servicing requests with reasonable response times (that is, less than four seconds):
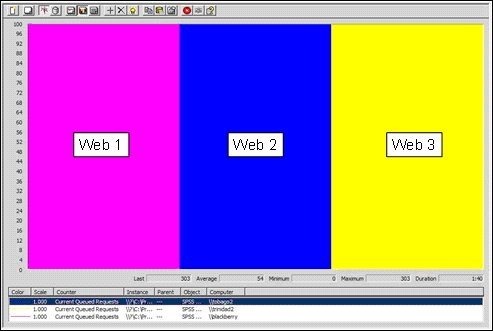
Monitoring Current Queued Requests for an overloaded cluster
In contrast, the following illustration shows Current Queued Requests for an overloaded cluster:
Poor performance can be the result of memory, network, disk I/O, CPU, or database problems; the most likely are CPU and database problems.
The Interviewing tier also uses threads for servicing requests. Requests are queued if there are no threads available, but this should not happen under normal circumstances. Queued requests on the Interviewing tier indicate that operations are probably timing out, and you will see messages containing error codes such as:
Client 5, HTTP −1, SOAP 0, TCP 0
These messages usually indicate a time-out when making a web service method call from the Web tier to the Interviewing tier. Timeouts for each web service method are as follows:
Method | Action | Timeout after |
|---|
CreateInterviewWithAuthentication | Authenticates and creates a new interview on the Interview tier | 90 seconds |
PostInterviewEvent | Posts an event to an interview | 60 seconds |
PercentLoaded | Gets the percentage load for the session engine | 5 seconds |
IsActive | Returns True if the session engine is active, otherwise returns False | 3 seconds |
Once requests are being queued, it is possible that IsActive fails due to timeouts, resulting in the interviewing engine being unregistered. Possible causes are as follows:
▪There is an infinite loop in the script that takes a long time to detect.
▪There is some logic in either the sample management or the routing script that takes a very long time to execute.
▪The UNICOM Intelligence Interviewer CPU is overloaded (constantly at 100%).
▪There is contention on the database.
See
See also