Creating tables using a data management script
When you create tables using a data management script, you generally use the
OnAfterJobEnd Event section, where the
dmgrJob.TableDocuments property gives you access to a collection of Table Document objects, one for each suitable output data source.
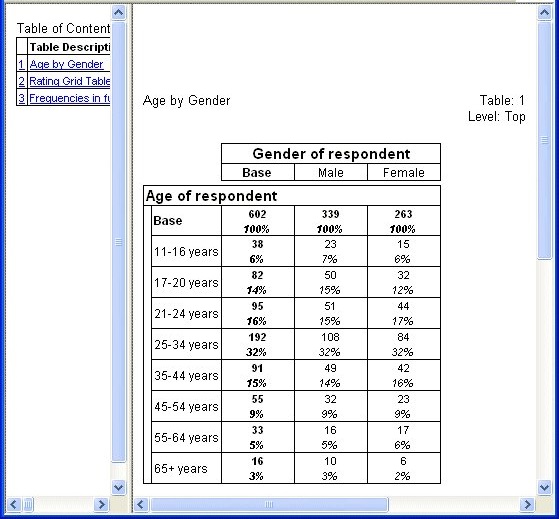
Here is a simple example that exports the Museum sample data set to an RDB database. It includes an OnAfterJobEnd Event section that sets up a simple crosstabulation (Age by Gender), a grid table for the Rating grid question, and a frequency table for the Education question. It then populates the tables, saves them as an .mtd file, and exports them (along with a chart for each table) to HTML:
Event(OnAfterJobEnd, "Create tables")
Dim TableDoc
Set TableDoc = dmgrJob.TableDocuments["RDBOutput"]
With TableDoc.Tables
' Create a table of Age by Gender
.AddNew("AgeByGender", "age * gender", "Age by Gender")
' Create a grid table for the Rating grid question
.AddNewGrid("RatingGrid", "rating", , "Rating Grid Table")
' Create a frequency table for the Education question
.AddNew("Education", "education", "Frequencies in full-time education")
' Add cumulative column percentages to the cell contents for the
' Education table
.Education.CellItems.AddNew(CellItemType.itCumColPercent)
End With
' Save the tables document
TableDoc.Save("C:\Program Files\IBM\SPSS\DataCollection\7\DDL\Output\TablesFirstScript.mtd")
' Populate the tables
TableDoc.Populate()
' Export the tables
With TableDoc.Exports["mrHtmlExport"]
.Properties["Interactive"] = True
.Properties["LaunchApplication"] = True
.Properties["DisplayOption"] = "Table and Chart"
.Properties["LayoutStyle"] = "Frame Table of Contents"
.Properties["PresentationStyle"] = "Black and White"
.Export("C:\Program Files\IBM\SPSS\DataCollection\7\DDL\Output\TablesFirstScript.htm")
End With
End Event
InputDataSource(Input)
ConnectionString = "Provider=mrOleDB.Provider.2; _
Data Source=mrDataFileDsc; _
Location=C:\Program Files\IBM\SPSS\DataCollection\7\DDL\Data\Data Collection File\museum.ddf; _
Initial Catalog=C:\Program Files\IBM\SPSS\DataCollection\7\DDL\Data\Data Collection File\museum.mdd"
End InputDataSource
OutputDataSource(RDBOutput)
ConnectionString = "Provider=mrOleDB.Provider.2; _
Data Source=mrRdbDsc2; _
Initial Catalog=''; _
Location='Provider=SQLOLEDB.1; _
Integrated Security=SSPI; _
Persist Security Info=False; _
Initial Catalog=TablesFirstScript; _
Data Source=localhost'; _
MR Init Project=TablesFirstScript"
MetaDataOutputName = "C:\Program Files\IBM\SPSS\DataCollection\7\DDL\Output\TablesFirstScript.mdd"
End OutputDataSource
In the OnAfterJobEnd Event section, there are two lines that show the main difference between creating tables in a data management script (.dms) file and in a standalone mrScriptBasic (.mrs) file:
Set TableDoc = dmgrJob.TableDocuments["RDBOutput"]
The above line shows how in the OnAfterJobEnd Event section in a data management script you can use the dmrgJob.TableDocuments property to get access to a table document object for each output data source that was written using a read-enabled CDSC. This means that you cannot write scripts to create tables on a non-UNICOM Intelligence Data Model format output data source or a Quantum-format output data source (because the Quantum CDSC is write-only).
.Education.CellItems.AddNew(CellItemType.itCumColPercent)
The above line uses an enumeration constant to add a new item of cell contents to the Education table. This is to draw attention to the fact that in a data management script, you can use the enumeration constants built into the Table Object Model, whereas in a standalone .
mrs file, you must use the equivalent numeric value. For more information, see
Creating a frequency table and defining cell contents.
The example shown above is available as a sample file called TablesFirstScript.dms. To run this sample, you must have UNICOM Intelligence Reporter and access to a SQL Server installation and appropriate user access rights. Before running the sample, set up a SQL Server database called TablesFirstScript. If you run this script more than once, you must delete the records in the database created by the previous run, otherwise the serial numbers are duplicated and errors occur. When exporting charts, the HTML Tables Export component uses IBM SPSS Visualization as the default charting engine. The optional Microsoft Office Web Components (OWC) can also be used: you can download them from the Microsoft Download Center. You can change the sample to export tables only, by changing the DisplayOption export property to “Table Only”. For example:
.Properties["DisplayOption"] = "Table Only"
Here is the HTML output:
As mentioned above, you usually create tables in the
OnAfterJobEnd Event section. However, you can also access the Table Document in the same way in the
OnJobStart Event section,
OnNextCase Event section, and
OnJobEnd Event section. If you decide to do this, make sure that you do not populate or export the tables in these sections, because that may lead to an error. Instead, save the tables in an .
mtd file (as shown in the sample above) and then open the .
mtd file in the OnAfterJobEnd Event section, where you can then populate and export the tables. For an example of opening an .
mtd file in a script, see
Opening an existing table document.
For information on sample data management scripts with table scripting sections, see
Table scripting sample Data Management scripts.
See also