Creating a frequency table and defining cell contents
Sample script file: MyFirstFrequencyTable.mrs
This example creates a table that has one categorical variable on the side axis and includes all of the information shown in a standard frequency table--counts, column percentages, and cumulative column percentages.
Const MDD_FILE = "[INSTALL_FOLDER]\IBM\SPSS\DataCollection\7\DDL\ Data\Xml\Museum.mdd"
Const XML_FILE = "[INSTALL_FOLDER]\IBM\SPSS\DataCollection\7\DDL\ Data\Xml\Museum.xml"
Const EXPORT_FILE = "[INSTALL_FOLDER]\IBM\SPSS\DataCollection\7\DDL\ Output\MyFirstFrequencyTable.htm"
Dim TableDoc, Table
Set TableDoc = CreateObject("TOM.Document")
TableDoc.DataSet.Load(MDD_FILE, , XML_FILE, "mrXmlDsc")
Set Table = TableDoc.Tables.AddNew("Education", "education", _
"Frequencies in full-time education")
Table.CellItems.AddNew(9, 2) ' itCumColPercent = 9
Table.CellItems[1].Decimals = 2
TableDoc.Populate()
With TableDoc.Exports.mrHtmlExport
.Properties["Interactive"] = True
.Properties["LaunchApplication"] = True
.Properties["DisplayOption"] = "Table Only"
.Export(EXPORT_FILE)
End With
User-defined constants
Notice that the
DataSet.Load method highlighted above looks different from the version shown in
Creating a simple table of Age by Gender. This example uses exactly the same parameters to open the museum sample data set, but specifies the file location parameters using
user-defined constants:
Const MDD_FILE = "[INSTALL_FOLDER]\IBM\SPSS\DataCollection\7\DDL\ Data\Xml\Museum.mdd"
Const XML_FILE = "[INSTALL_FOLDER]\IBM\SPSS\DataCollection\7\DDL\ Data\Xml\Museum.xml"
This is a useful method of specifying file paths and other parameters that you need to change from time to time or that you use more than once in a script. You specify the constant at the start of the script, then each time you need to refer to the path, you can type the name of the constant instead. When you change a file name or path you only need to make the change once, at the start of the file.
An additional constant specifies the export file path:
Const EXPORT_FILE = "[INSTALL_FOLDER]\IBM\SPSS\DataCollection\7\DDL\ Output\MyFirstFrequencyTable.htm"
You will find that subsequent sample scripts in this tutorial use constants in this way, to make it easier to adapt the scripts when data sets are not in the default locations, or when you want to use the scripts with your own data sets.
Cell contents collection
Notice that the Table.CellItems collection is highlighted. This defines the cell contents for the table. Each item in the cells of the table is a separate CellItem object in this collection. The second highlighted line in the above example adds a new cell item for cumulative column percentages to the collection and sets its decimal precision to 2.
Cell item constants
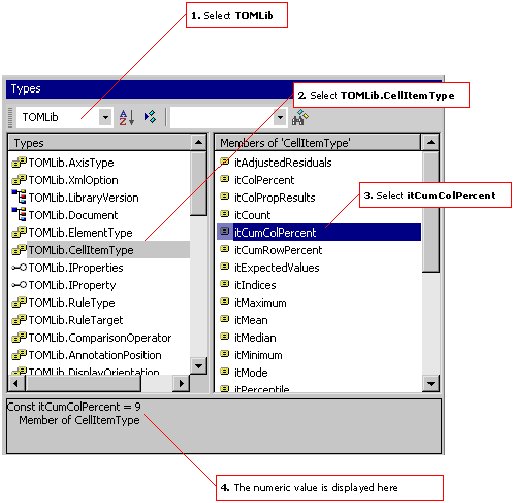
Available cell contents lists all of the types of cell contents that are available and the constants and their associated values that you use to specify them in your scripts. You can also get a list of the constants and their associated values in the UNICOM Intelligence Professional Types pane. See
UNICOM Intelligence Professional window for more information.
You can use the constants only if your script is part of a data management script (.dms) file, because the Table Object Model is then registered with the mrScript engine, which makes the constants built into the Object Model available to the script. If your script is a standalone mrScriptBasic (.mrs) file, you must use the numeric value or set up user-defined constants to represent the values. For example, if you want to include this example in a data management script you could replace the highlighted line with the following:
Table.CellItems.AddNew(CellItemType.itCumColPercent, 2)
Note that unlike Visual Basic, you need to prefix the constant name with the type definition name, otherwise you will get an error (typically “Undefined variable”). This is because mrScriptBasic handles constant namespaces differently from Visual Basic. For more information, see
How does mrScriptBasic compare to Visual Basic?.
Notice that the position of the new item in the collection is not specified in this example. This means that the new item is automatically added to the end of the collection and so the cumulative column percentages will appear after the counts and column percentages that are included as the first and second items by default.
If you wanted the cumulative column percentages to appear first, you would set the Index parameter to 0, like this:
Table.CellItems.AddNew(9, 2, , 0)
You specify the position as 0 because it is controlled by a zero-based index. Zero-based means that the first item has index 0, the second item has index 1, etc.
Decimal places
The third highlighted line in the script sets the decimal precision for the column percentages to 2. Notice that we access the item in the collection by the index, which corresponds to its position in the collection. As noted above, it is a zero-based index, which means that you access the first item as 0, the second as 1, the third as 2, etc.
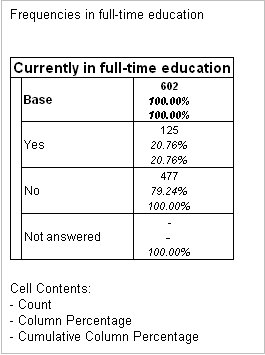
Here is the table produced by the script:
Default cell contents
You may be wondering where the default cell contents come from and whether you can change them. The answer is that when you create a table, the default cell items are taken from the Document.Default.CellItems collection. You can add items to this collection in the same way that you can add items to the Table.CellItems collection. If you want to remove one of the default cell contents, you use the Remove method, like this:
TableDoc.Default.CellItems.Remove(1)
Note that removing an item from the Default.CellItems collection only affects tables that you subsequently create. It does not affect tables that you have already created. This means that if you want to use this line to remove the column percentages from the table, you would need to insert this line into the script before the line that creates the table.
Table display features
Details of the cell contents are shown in the table footer. Headers and footers show are created using the annotation feature. In the example table above, the header and footer were created automatically using the default annotations. However, it is easy to change the default annotations or to set up customized annotations for individual tables. See
Annotations for more information.
If you look at the table again, you will notice that the column percentages for the Not answered row are shown as a hyphen (-). This is the default character that is displayed for zero percentage values. The next topic shows you how to change this character and to hide all-zero rows and columns.
Requirements
UNICOM Intelligence Reporter
Next
See also